ACT Science : Physics
Study concepts, example questions & explanations for ACT Science


All ACT Science Resources
Example Questions
Example Question #1333 : Act Science
Figure 1 shows the electromagnetic spectrum, or the spectrum of energies of light emitted from the sun. The top axis shows each type of electromagnetic wave as a frequency (given in hertz, Hz), where high frequencies correspond with high energy light waves. The bottom axis shows wavelengths (given in meters, m) of each type of light, where short wavelengths correspond with higher energy light waves. There is an inset to show visible light, where higher energy violet light typically has a wavelength around 400nm and 700nm corresponds to lower energy red light. Visible light, as shown in the figure, is typically measured in nanometers (nm), where there are 
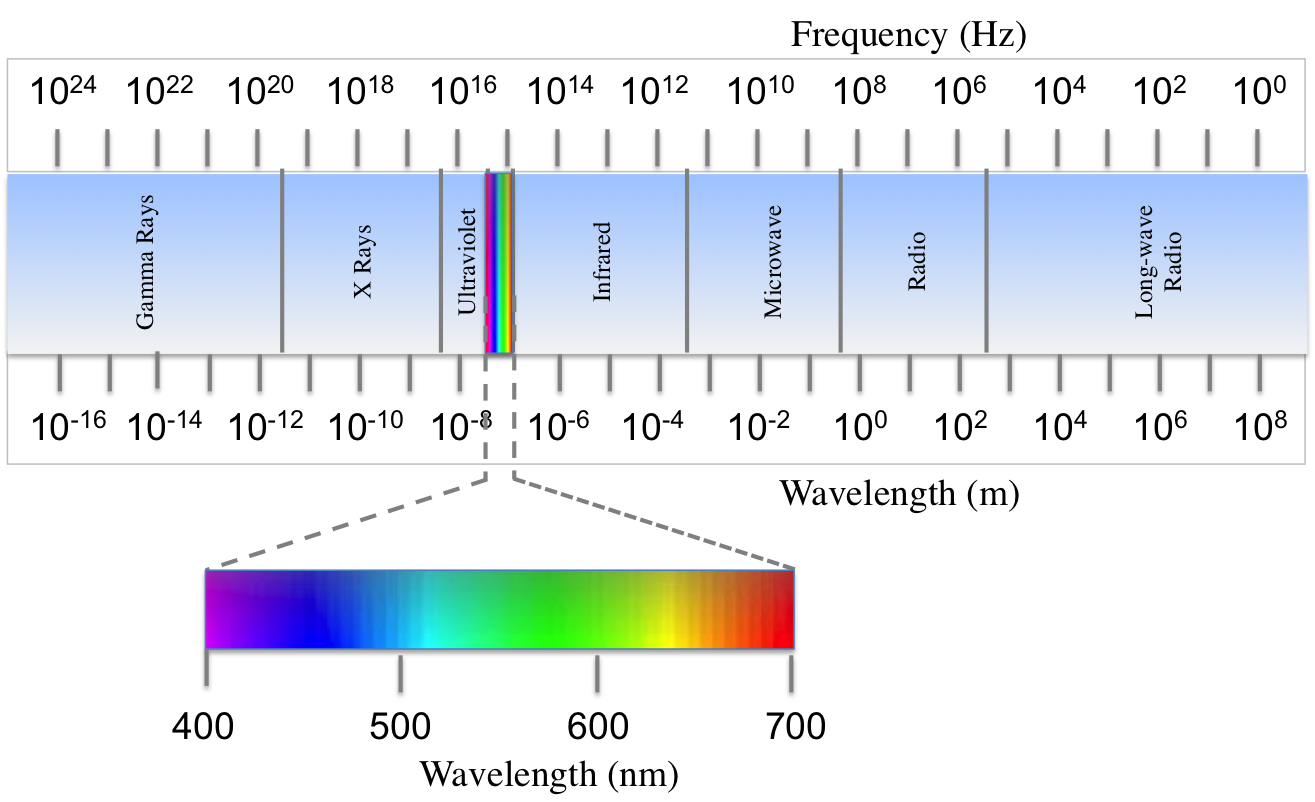
Figure 1
A scientist studying the types of electromagnetic radiation emitted from the sun compiled data about the intensity of light at various wavelengths. It was found that less than 1% of radiation from the sun is of wavelengths shorter than 100nm or longer than 2500nm. Intensity of radiation at middle wavelengths was graphed in Figure 2.
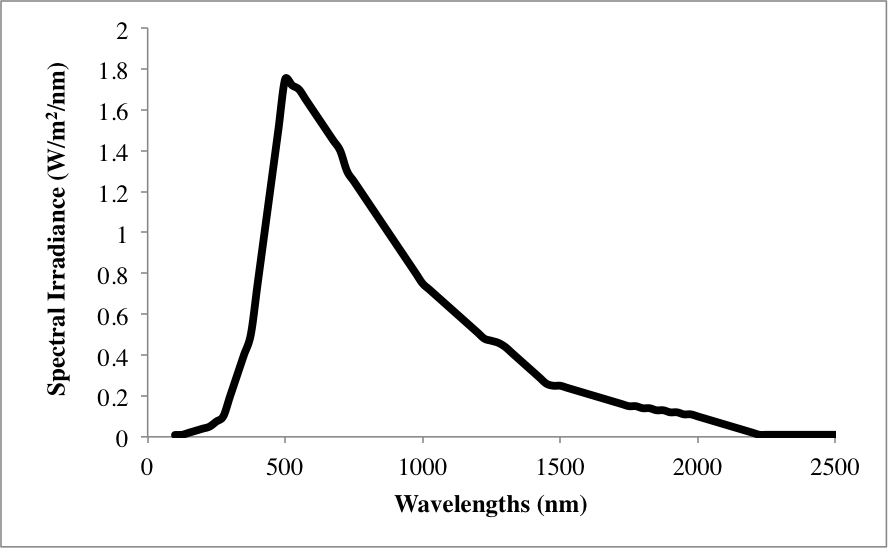
Figure 2
As you may know, exposure to ultraviolet light is dangerous as it is energetic enough to degrade DNA, leading to cancer. Assuming that all types of radiation that are more energetic than ultraviolet light are also carcinogenic, what of the following types of light likely cause cancer as well?
Gamma rays and radio waves
Visible light and infrared
Gamma rays and x-rays
Visible light and x-rays
Gamma rays and x-rays
According to Figure 1, ultraviolet light has a frequency on the order of 

Example Question #21 : How To Find Data Representation In Physics
Figure 1 shows the electromagnetic spectrum, or the spectrum of energies of light emitted from the sun. The top axis shows each type of electromagnetic wave as a frequency (given in hertz, Hz), where high frequencies correspond with high energy light waves. The bottom axis shows wavelengths (given in meters, m) of each type of light, where short wavelengths correspond with higher energy light waves. There is an inset to show visible light, where higher energy violet light typically has a wavelength around 400nm and 700nm corresponds to lower energy red light. Visible light, as shown in the figure, is typically measured in nanometers (nm), where there are
Figure 1
A scientist studying the types of electromagnetic radiation emitted from the sun compiled data about the intensity of light at various wavelengths. It was found that less than 1% of radiation from the sun is of wavelengths shorter than 100nm or longer than 2500nm. Intensity of radiation at middle wavelengths was graphed in Figure 2.
Figure 2
Figure 2 shows an appreciable amount of radiation is produced by the sun with a wavelength of 2000nm. What type of radiation is it, and what is its wavelength in meters?
Microwaves;

Infrared;

Microwaves;

Infrared;

Infrared;
2000nm can be expressed as 

Use the given electromagnetic spectrum to match this wavelength to infrared light.
Example Question #1342 : Act Science
Figure 1 shows the electromagnetic spectrum, or the spectrum of energies of light emitted from the sun. The top axis shows each type of electromagnetic wave as a frequency (given in hertz, Hz), where high frequencies correspond with high energy light waves. The bottom axis shows wavelengths (given in meters, m) of each type of light, where short wavelengths correspond with higher energy light waves. There is an inset to show visible light, where higher energy violet light typically has a wavelength around 400nm and 700nm corresponds to lower energy red light. Visible light, as shown in the figure, is typically measured in nanometers (nm), where there are
Figure 1
A scientist studying the types of electromagnetic radiation emitted from the sun compiled data about the intensity of light at various wavelengths. It was found that less than 1% of radiation from the sun is of wavelengths shorter than 100nm or longer than 2500nm. Intensity of radiation at middle wavelengths was graphed in Figure 2.
Figure 2
Which of these correctly lists the different types of electromagnetic radiation in order of increasing energy?
Microwave, Visible, Ultraviolet, Infrared
Microwave, X-rays, Visible, Ultraviolet
Radio, Visible, Gamma, X-rays
Radio, Microwave, Visible, Gamma
Radio, Microwave, Visible, Gamma
Figure 1 shows radiation in order of decreasing energy from left to right. Thus, the correct answer must list types of radiation from right to left from Figure 1. Energy is directly proportional to frequency, and indirectly proportional to wavelength.
Example Question #1343 : Act Science
Figure 1 shows the electromagnetic spectrum, or the spectrum of energies of light emitted from the sun. The top axis shows each type of electromagnetic wave as a frequency (given in hertz, Hz), where high frequencies correspond with high energy light waves. The bottom axis shows wavelengths (given in meters, m) of each type of light, where short wavelengths correspond with higher energy light waves. There is an inset to show visible light, where higher energy violet light typically has a wavelength around 400nm and 700nm corresponds to lower energy red light. Visible light, as shown in the figure, is typically measured in nanometers (nm), where there are
Figure 1
A scientist studying the types of electromagnetic radiation emitted from the sun compiled data about the intensity of light at various wavelengths. It was found that less than 1% of radiation from the sun is of wavelengths shorter than 100nm or longer than 2500nm. Intensity of radiation at middle wavelengths was graphed in Figure 2.
Figure 2
Which of the following types of light are emitted in spectral irradiances of greater than 
I. Visible light
II. Gamma rays
III. Microwaves
I only
I and III
I, II, and III
III only
I only
The introduction tells us that wavelengths not shown in Figure 2 are emitted from the sun at negligible amounts in comparison to those pictured. At 100nm, ultraviolet is the highest energy wave shown. The lowest energy wavelength shown is 2500nm. This low energy bound corresponds with infrared light. Thus, only ultraviolet, visible, and infrared radiation types are emitted at intensities higher than 
Example Question #1344 : Act Science
Engineers are evaluating four potential technologies. These technologies are to be used as power plants that are considered "clean" energy. The estimated energy output of these plants were calculated and the resources needed to run these were also listed.
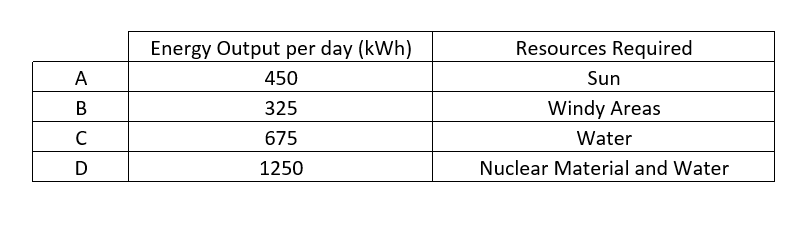
What is the expected energy output, in kiloWatt hours per a day, if there were no resource limitations?


If there were no resource limitations the engineers would build the power plant with the highest energy output in order to obtain the most benefits from the plant. This would lead the engineers to choose option D. The expect energy output per a day would be 1250kWh.
Example Question #1345 : Act Science
A company developed new prototype car and wanted to test the new car. The car's acceleration time from 0mph to 60mph and stopping time from 60mph to 0mph were measured. An obstacle course involving a lot of turns was also constructed to determine how well the car can handle turning. The main concern of the company is the safety of the car and therefore all of the tests were performed on dry concrete, concrete after simulated rain, concrete that was covered with snow and in sand.
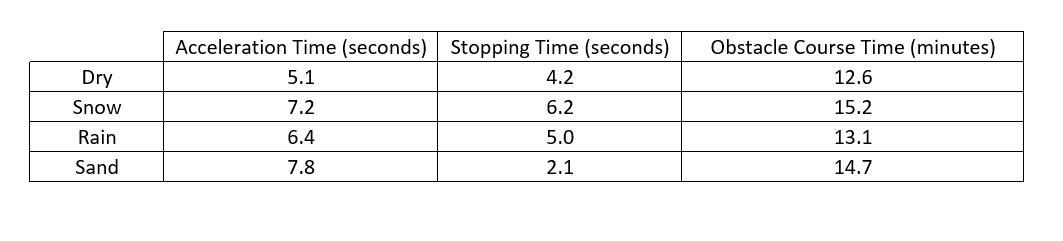
What is the relationship between stopping time and obstacle course time?
As stopping time increases so does obstacle course time
As stopping time decreases, obstacle course time increases
As stopping time increases, obstacle course time decreases
There is no relationship
There is no relationship
In the snowy conditions there was the longest stopping time of 6.2 seconds and the longest course time of 15.2 minutes indicating that as the stopping time increases so does the obstacle course time. However the sandy conditions gave the shortest stopping time, but the second longest obstacle course time. This would indicate that as stopping time decreases obstacle course time increases, which contradicts the conclusion drawn from the snowy data. Therefore there is no relationship between stopping time and obstacle course time.
Example Question #1346 : Act Science
A student conducts an experiment in which she suspends a ball mass 


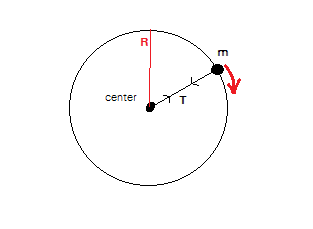
The student first tries the experiment spinning the ball at a speed of 


The correct answer is 
^2}{R}=\frac{m4v^2}{R}")
Example Question #1347 : Act Science
A student conducts an experiment in which she suspends a ball mass 


Which of the following could be a graph of force in the string as a function of radius 
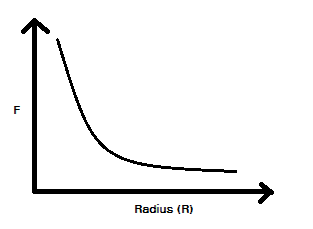
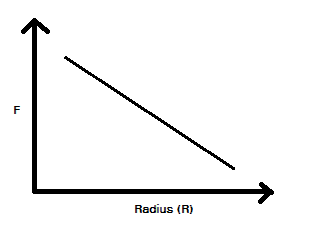
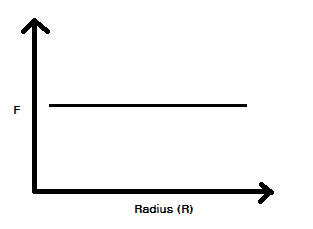
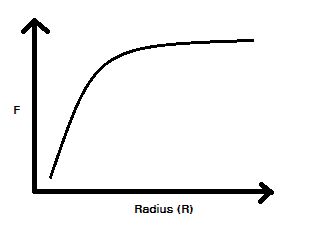
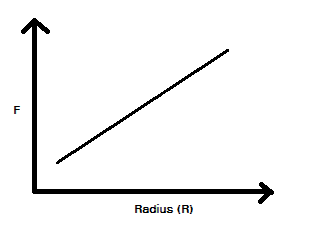
We are looking for a graph that represents an inverse relationship. That is, force is proportional to the inverse of 


Example Question #1348 : Act Science
Sometimes scientists need to scale down experiments because collecting full-scale data may not be practical or possible. Most of the time, the data collected during a small scale-experiment is an accurate indicator of full-scale results. For example, research of craters on the Earth’s surface has indicated that the Earth has experienced a history of massive meteor collisions. It has been hypothesized that, amongst other things, these impacting meteorites caused the Earth’s oceans to vaporize. The detrimental effects associated with meteor collisions would have made the planet to be uninhabitable to humans. Due to these adverse effects, an experiment that could produce meteor-sized craters would not be possible in a full-scale setting.
Researchers have developed small-scale experiments that are exemplary of Newton’s three laws of motion. Newton’s first law states that an object in motion will stay in motion unless it is acted on by another force. This phenomenon is known as inertia. The second law comes in the form of an equation that calculates how much force is exerted on two colliding objects with respect to mass and acceleration. In other words force is equal to the mass of an object multiplied by its acceleration. The third law states that for every action there is an equal and opposite reaction. In other words, forces always occur in pairs. A counter force that is equal in magnitude and opposite in direction compliments each force in a particular direction. For example, if you push downwards on a table then the table, in theory, pushes upwards with the same force.
In a particular small-scale exercise, students were asked to design an experiment in which two “meteorites” would be dropped into a medium of sand and the subsequent crater diameters would be measured. Afterwards, the sand would be leveled and the experiment would be repeated. The students were asked to identify all of the factors that could affect the formation of the craters. This was done in order to ensure that each experiment was testing one independent and one dependent variable at a time. Otherwise, it would be unclear which variable is causing the observed effect. Possible variables that could alter the outcome of the experiment included but were not limited to the following: height of the fall, speed of the “meteorite,” angle of impact, and the mass of meteorite.
Consider an experiment that seeks to identify the mass of the meteorite analog. All other variables would have to remain constant in order to ensure accurate results. In order to do this, the height of the fall was set to one meter. The object was placed on top of a vertical meter stick. In order to keep the acceleration and height of the drop constant, it was rolled off of the stick instead of being pushed or simply dropped. Last, a protractor was used to keep the meter stick at a ninety-degree angle. In the procedure, a marble and a golf ball were used as “meteorites” of different masses.
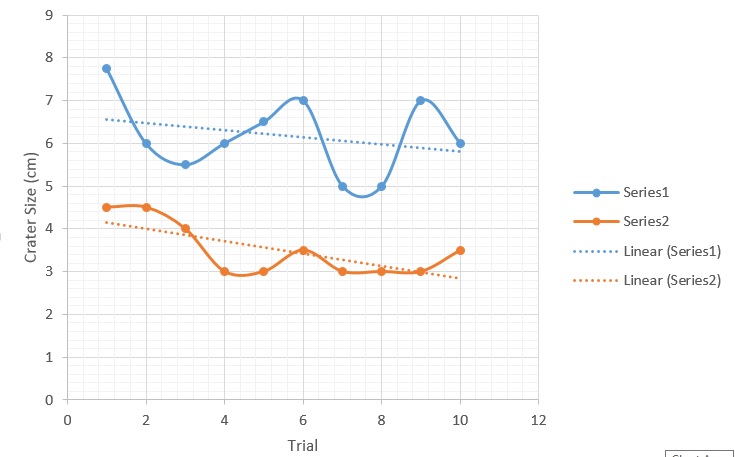
The results of the experiment were recorded in the table and figure provided.
| Crater Diameter (cm) | ||
| Trial Number | ||
| Marble (mass = 4g) | Golf ball (mass = 46g) | |
| 1 | 4.5 | 7.75 |
| 2 | 4.5 | 6 |
| 3 | 4 | 5.5 |
| 4 | 3 | 6 |
| 5 | 3 | 6.5 |
| 6 | 3.5 | 7 |
| 7 | 3 | 5 |
| 8 | 3 | 5 |
| 9 | 3 | 7 |
| 10 | 3.5 | 6 |
| Average | Average | |
| 3.5 cm | 6.175 cm | |
The equation for kinetic energy (energy in motion) is as follows:

In this equation, kinetic energy equals one half of the mass of the object times its velocity squared. Based on this information, identify what would happen to the force of the impact if the velocity is quadrupled?
The force would be multiplied by a factor of four when the velocity is quadrupled.
None of these
The force would be multiplied by a factor of sixteen when the velocity is quadrupled.
The force would be multiplied by a factor of two when the velocity is quadrupled.
The force would be multiplied by a factor of sixteen when the velocity is quadrupled.
In order to solve this question we should substitute the the following values for mass and velocity:


Now, let's quadruple the velocity to the following:


Let's consider another scenario. Substitute the the following values for mass and velocity:


Now, let's quadruple the velocity to the following:


From this information we can see that when the velocity is quadrupled, the force is multiplied by a factor of sixteen.
Example Question #1349 : Act Science
Sometimes scientists need to scale down experiments because collecting full-scale data may not be practical or possible. Most of the time, the data collected during a small scale-experiment is an accurate indicator of full-scale results. For example, research of craters on the Earth’s surface has indicated that the Earth has experienced a history of massive meteor collisions. It has been hypothesized that, amongst other things, these impacting meteorites caused the Earth’s oceans to vaporize. The detrimental effects associated with meteor collisions would have made the planet to be uninhabitable to humans. Due to these adverse effects, an experiment that could produce meteor-sized craters would not be possible in a full-scale setting.
Researchers have developed small-scale experiments that are exemplary of Newton’s three laws of motion. Newton’s first law states that an object in motion will stay in motion unless it is acted on by another force. This phenomenon is known as inertia. The second law comes in the form of an equation that calculates how much force is exerted on two colliding objects with respect to mass and acceleration. In other words force is equal to the mass of an object multiplied by its acceleration. The third law states that for every action there is an equal and opposite reaction. In other words, forces always occur in pairs. A counter force that is equal in magnitude and opposite in direction compliments each force in a particular direction. For example, if you push downwards on a table then the table, in theory, pushes upwards with the same force.
In a particular small-scale exercise, students were asked to design an experiment in which two “meteorites” would be dropped into a medium of sand and the subsequent crater diameters would be measured. Afterwards, the sand would be leveled and the experiment would be repeated. The students were asked to identify all of the factors that could affect the formation of the craters. This was done in order to ensure that each experiment was testing one independent and one dependent variable at a time. Otherwise, it would be unclear which variable is causing the observed effect. Possible variables that could alter the outcome of the experiment included but were not limited to the following: height of the fall, speed of the “meteorite,” angle of impact, and the mass of meteorite.
Consider an experiment that seeks to identify the mass of the meteorite analog. All other variables would have to remain constant in order to ensure accurate results. In order to do this, the height of the fall was set to one meter. The object was placed on top of a vertical meter stick. In order to keep the acceleration and height of the drop constant, it was rolled off of the stick instead of being pushed or simply dropped. Last, a protractor was used to keep the meter stick at a ninety-degree angle. In the procedure, a marble and a golf ball were used as “meteorites” of different masses.
The results of the experiment were recorded in the table and figure provided.
| Crater Diameter (cm) | ||
| Trial Number | ||
| Marble (mass = 4g) | Golf ball (mass = 46g) | |
| 1 | 4.5 | 7.75 |
| 2 | 4.5 | 6 |
| 3 | 4 | 5.5 |
| 4 | 3 | 6 |
| 5 | 3 | 6.5 |
| 6 | 3.5 | 7 |
| 7 | 3 | 5 |
| 8 | 3 | 5 |
| 9 | 3 | 7 |
| 10 | 3.5 | 6 |
| Average | Average | |
| 3.5 cm | 6.175 cm | |
Which of the following best describes how mass changes for varying kinetic energies when the velocity remains constant?
There is a negative linear relationship between mass and kinetic energy
There is a positive linear relationship between mass and kinetic energy
There is a negative exponential relationship between mass and kinetic energy
There is a positive exponential relationship between mass and kinetic energy
There is a positive linear relationship between mass and kinetic energy
For this we have to solve for mass in the kinetic equation:

When we solve for mass, we get the following equation:

Assume the following velocity:

When the kinetic energy is 

When the kinetic energy is 

When the kinetic energy is 

This represents a positive linear relationship between the mass and kinetic energy.


All ACT Science Resources

