ACT Science : Physics
Study concepts, example questions & explanations for ACT Science


All ACT Science Resources
Example Questions
Example Question #1328 : Act Science
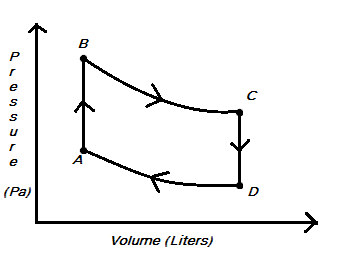
A scientist is testing the efficiency of a regular heat engine. A heat engine functions in the following manner: a chamber of gas is heated, increasing its pressure, which then causes the gas to expand to relieve some of that pressure. Next, the gas chamber cools off slightly, causing the pressure to decrease once again. This propagates the gas to compress slightly. Simply stated, this process produces mechanical work as the gas's expansion and contraction causes movement. A graph of the heat engine's pressure and volume is represented below, the letters A through D representing steps in the engine's repeating cycle.
Mechanical work for a gas process (movement from one pressure-volume state to another) is calculated using the formula 


According to the equation 

From A to B
From B to C
From D to A
From C to D
From A to B and from C to D.
From A to B and from C to D.
This question may seem difficult but in reality it is quite easy. Pay attention to the equation given. Since 

Example Question #1331 : Act Science
A scientist is testing the efficiency of a regular heat engine. A heat engine functions in the following manner: a chamber of gas is heated, increasing its pressure, which then causes the gas to expand to relieve some of that pressure. Next, the gas chamber cools off slightly, causing the pressure to decrease once again. This propagates the gas to compress slightly. Simply stated, this process produces mechanical work as the gas's expansion and contraction causes movement. A graph of the heat engine's pressure and volume is represented below, the letters A through D representing steps in the engine's repeating cycle.
Mechanical work for a gas process (movement from one pressure-volume state to another) is calculated using the formula 

A gas process is considered isobaric if the pressure is held constant throughout the process. Which processes involved in the heat engine cycle described above can be considered isobaric?
B to C
D to A
A to B
None of the above processes were isobaric.
C to D
None of the above processes were isobaric.
An isobaric process means that pressure does not change throughout the process. If you look at the pressure volume diagram provided, pressure is always changing. You just need to follow the process along with your eye and see that a movement from any point in the cycle to another involves either moving up or down the 
Example Question #11 : How To Find Data Representation In Physics
A scientist is testing the efficiency of a regular heat engine. A heat engine functions in the following manner: a chamber of gas is heated, increasing its pressure, which then causes the gas to expand to relieve some of that pressure. Next, the gas chamber cools off slightly, causing the pressure to decrease once again. This propagates the gas to compress slightly. Simply stated, this process produces mechanical work as the gas's expansion and contraction causes movement. A graph of the heat engine's pressure and volume is represented below, the letters A through D representing steps in the engine's repeating cycle.
Mechanical work for a gas process (movement from one pressure-volume state to another) is calculated using the formula
A gas process is considered isochoric if the volume is held constant throughout the process. Which of the gas processes shown above can be considered isochoric?
B to C
D to A
A to B and C to D
C to D
A to B
A to B and C to D
If we look at any gas process involved in this cycle, the volume only appears to change from A to B and from C to D. This we know because when we trace the cycle, it is only in these processes that we are not moving at all along the 
Example Question #21 : How To Find Data Representation In Physics
A scientist is testing the efficiency of a regular heat engine. A heat engine functions in the following manner: a chamber of gas is heated, increasing its pressure, which then causes the gas to expand to relieve some of that pressure. Next, the gas chamber cools off slightly, causing the pressure to decrease once again. This propagates the gas to compress slightly. Simply stated, this process produces mechanical work as the gas's expansion and contraction causes movement. A graph of the heat engine's pressure and volume is represented below, the letters A through D representing steps in the engine's repeating cycle.
Mechanical work for a gas process (movement from one pressure-volume state to another) is calculated using the formula
The temperature of a gas is positively correlated with the pressure of that gas and negatively correlated with the volume of that gas. At which point is the gas in the engine's chamber at a maximum temperature?
Point C
Point A
The gas never reaches a maximum temperature.
Point D
Point B
Point B
This question may seem like it is asking for extraneous information, but in reality, it is just asking you to interpret the diagram given. If the temperature is positively correlated with pressure and negatively correlated with volume, we are looking for a point with the highest pressure and lowest volume. At the lowest volume are points A and B. Point B is at a higher pressure, indicating that it likely has a higher temperature than point A. Therefore, Point B is our answer.
Example Question #1331 : Act Science
The electrons of an atom surround the nucleus and reside in atomic orbitals. In transition metals such as iron (


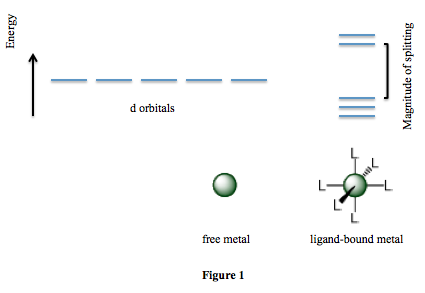
Scientists perform a number of experiments to determine how various factors affect the magnitude of splitting. They find that the charge on the metal, the metal's position on the periodic table (whether it resides in Period 4, 5, or 6), and the identity of the ligand are all important factors. The scientists' results are summarized in Table 1. Note that a higher value of 
Table 1
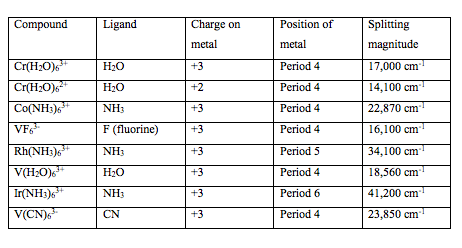
Suppose the compound _6}^{4+}")


As the charge on 


Example Question #1332 : Act Science
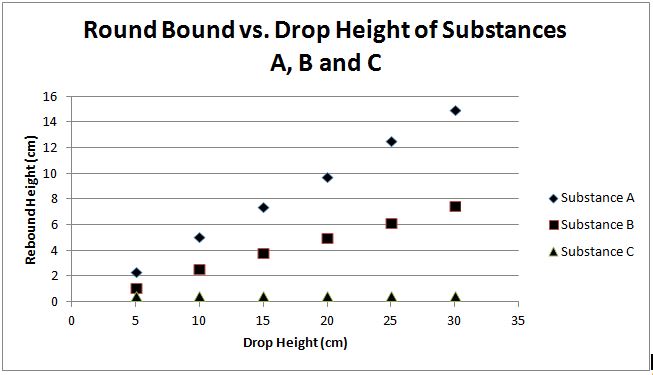
An engineer wants to design a prank toy that will be thrown onto the ground. It looks like a superball (bouncing ball), but does not bounce. The engineer has Subtance A, Substance B, and Substance C that he drops from various heights. All of the tests are performed by dropping the substances on the same surface and each height is tested multiple times. The error between experiments is minimal and too small to be seen on the graph. The engineer records the maximum rebound height of each substance at the various drop heights. This data is displayed in the graph below.
If Substance B was dropped from a height of 

Cannot be determined from the given information


One method to solve this problem is to view the graph for Substance B and draw a line up from 

Alternatively, a process of elimination can be performed. Observation of the figure reveals that Substance B has a linear relationship between plotted points. The data point at the drop height of about 


Example Question #1333 : Act Science
An engineer wants to design a prank toy that will be thrown onto the ground. It looks like a superball (bouncing ball), but does not bounce. The engineer has Subtance A, Substance B, and Substance C that he drops from various heights. All of the tests are performed by dropping the substances on the same surface and each height is tested multiple times. The error between experiments is minimal and too small to be seen on the graph. The engineer records the maximum rebound height of each substance at the various drop heights. This data is displayed in the graph below.
If the engineer wants to achieve a rebound height of 
None of the choices are correct


As seen in the figure, Substance A possesses a linear relationship between plotted points. Furthermore, there is no information present to suggest that greater drop heights could result in a lower maximum rebound height in future trials of Substance A. In order to answer this question, simply draw a straight line through the data points of Substance A until it intersects the 

Example Question #21 : How To Find Data Representation In Physics
A researcher is investigating new solar technology. The researcher looks at combinations of solar panels and solar rechargeable batteries that were provided from research labs A, B, C and D. The combinations of solar panels and solar rechargeable batteries are measured for their efficiency, the amount of time it takes to fully charge a battery, and the life of each fully charged battery used to power a home. The experiments were conducted using a UV light. The batteries recharge when the solar panels are exposed to UV light and are depleted of charge when being used for power. The solar panels will not recharge the batteries on cloudy days.
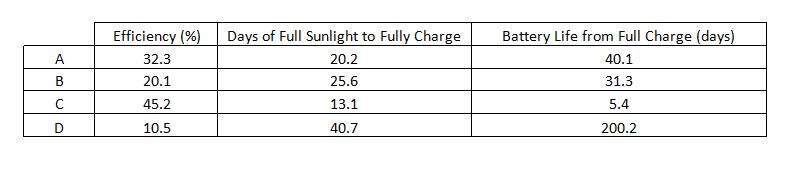
Based on the provided data, what relationship can be found between the efficiency of the solar panel and the amount of time it takes to fully charge the battery? Assume that the production differences between batteries and solar panels is negligible across the different labs.
As the efficiency increases, the time it takes to charge the battery decreases
Cannot be determined
As the efficiency decreases, the time it takes to charge the battery decreases
There is no relationship between the efficiency and the time it takes to charge the battery
As the efficiency increases, the time it takes to charge the battery increases
As the efficiency increases, the time it takes to charge the battery decreases
According to the data, it appears that as efficiency increases the time it takes to fully charge the battery decreases. This trend is consistent throughout all the labs; therefore, it is the correct answer. This is true only because the differences between the products from different labs are negligible. In a real-world setting, we would need to observe extraneous variables inherent in each of the different labs and methods of production.
Example Question #1335 : Act Science
Figure 1 shows the electromagnetic spectrum, or the spectrum of energies of light emitted from the sun. The top axis shows each type of electromagnetic wave as a frequency (given in hertz, Hz), where high frequencies correspond with high energy light waves. The bottom axis shows wavelengths (given in meters, m) of each type of light, where short wavelengths correspond with higher energy light waves. There is an inset to show visible light, where higher energy violet light typically has a wavelength around 400nm and 700nm corresponds to lower energy red light. Visible light, as shown in the figure, is typically measured in nanometers (nm), where there are 
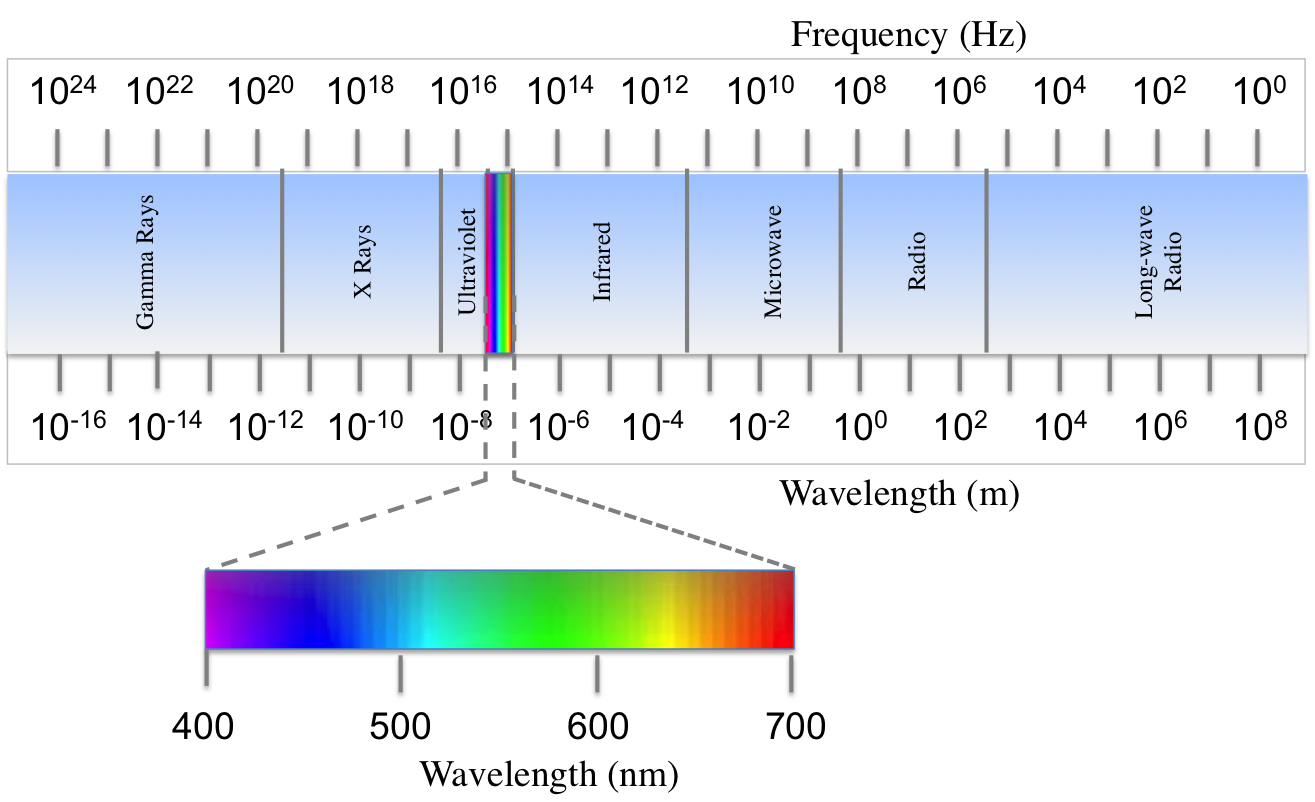
Figure 1
A scientist studying the types of electromagnetic radiation emitted from the sun compiled data about the intensity of light at various wavelengths. It was found that less than 1% of radiation from the sun is of wavelengths shorter than 100nm or longer than 2500nm. Intensity of radiation at middle wavelengths was graphed in Figure 2.
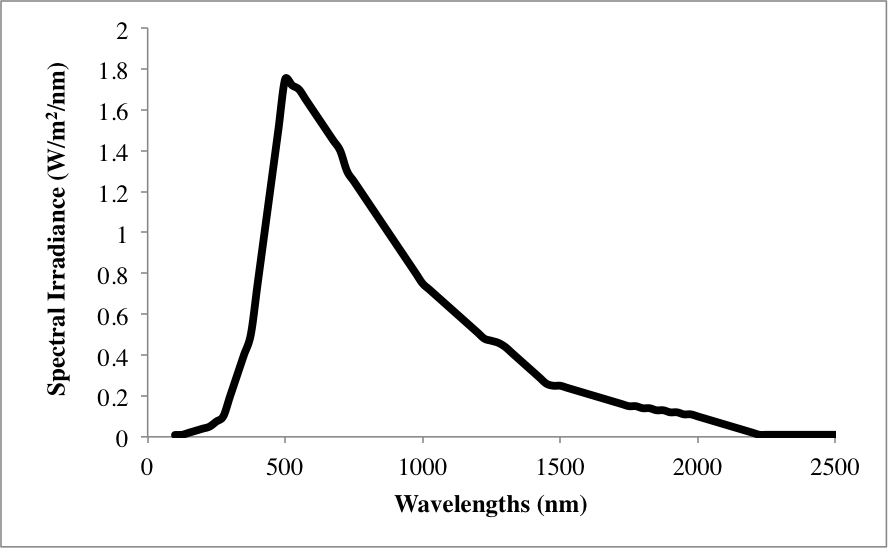
Figure 2
Electromagnetic radiation with a frequency of 


According to Figure 1, radiation with a frequency of 

Example Question #1336 : Act Science
Figure 1 shows the electromagnetic spectrum, or the spectrum of energies of light emitted from the sun. The top axis shows each type of electromagnetic wave as a frequency (given in hertz, Hz), where high frequencies correspond with high energy light waves. The bottom axis shows wavelengths (given in meters, m) of each type of light, where short wavelengths correspond with higher energy light waves. There is an inset to show visible light, where higher energy violet light typically has a wavelength around 400nm and 700nm corresponds to lower energy red light. Visible light, as shown in the figure, is typically measured in nanometers (nm), where there are 
Figure 1
A scientist studying the types of electromagnetic radiation emitted from the sun compiled data about the intensity of light at various wavelengths. It was found that less than 1% of radiation from the sun is of wavelengths shorter than 100nm or longer than 2500nm. Intensity of radiation at middle wavelengths was graphed in Figure 2.
Figure 2
What is the most abundant type of light emitted from the sun?
Ultraviolet light
Green visible light
Infrared light
Red visible light
Green visible light
Figure 2 has a peak at a wavelength roughly longer than 500nm. As the inset in Figure 1 shows that visible light ranges from 400-700nm, we see that it must be some type of visible light. Specifically, wavelengths slightly longer than 500nm appear to be in the green light range.


All ACT Science Resources

