ACT Science : Physics
Study concepts, example questions & explanations for ACT Science


All ACT Science Resources
Example Questions
Example Question #201 : Physics
Sound waves travel through a medium by mechanically disturbing the particles of that medium. As particles in the medium are displaced by the sound wave, they in turn act upon neighboring particles. In this fashion, the wave travels through the medium through a parallel series of disturbed particles. Like in other forms of motion, the rate at which the sound wave travels can be measured by dividing the distance over which the wave travels by the time required for it to do so.
Study 1
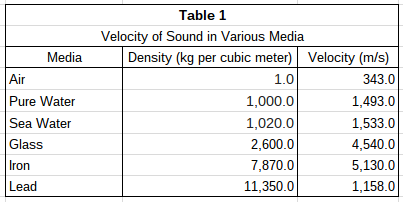
A group of students hypothesizes that the velocity of sound is dependent upon the density of the medium through which it passes. They propose that with more matter in a given space, each particle needs to travel a shorter distance to disturb the adjacent particles. Using two microphones and a high speed recording device, the students measured the delay from the first microphone to the second. They chose a variety of media, shown in Table 1, and measured the velocity of sound through each using their two-microphone setup. The results are found in Table 1.
Study 2
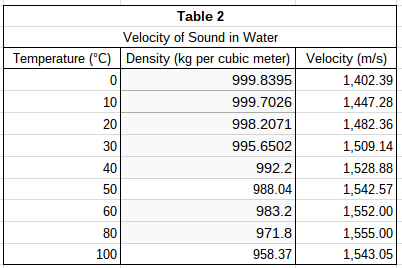
The students wanted to test their hypothesis by using the same medium at different densities. To do this, they heated pure water to various temperatures and repeated the procedure described in Study 1. Their results can be found in Table 2.
According to the data in Study 1, as density increases, what happens to the velocity of sound?
It decreases.
It increases.
It does not change.
It either increases or decreases.
It either increases or decreases.
The velocity of sound in different media is listed in the third column of Table 1. Density of the media increases as you move down the column. Velocity increases along with density except between iron and lead. This means that no direct relationship between density and velocity can be drawn; the velocity of sound can either increase or decrease as density increases.
Example Question #201 : Physics
Sound waves travel through a medium by mechanically disturbing the particles of that medium. As particles in the medium are displaced by the sound wave, they in turn act upon neighboring particles. In this fashion, the wave travels through the medium through a parallel series of disturbed particles. Like in other forms of motion, the rate at which the sound wave travels can be measured by dividing the distance over which the wave travels by the time required for it to do so.
Study 1
A group of students hypothesizes that the velocity of sound is dependent upon the density of the medium through which it passes. They propose that with more matter in a given space, each particle needs to travel a shorter distance to disturb the adjacent particles. Using two microphones and a high speed recording device, the students measured the delay from the first microphone to the second. They chose a variety of media, shown in Table 1, and measured the velocity of sound through each using their two-microphone setup. The results are found in Table 1.
Study 2
The students wanted to test their hypothesis by using the same medium at different densities. To do this, they heated pure water to various temperatures and repeated the procedure described in Study 1. Their results can be found in Table 2.
In Study 1, which medium tested had the greatest density?
Sea Water
Iron
Glass
Air
Lead
Lead
The densities for the media in Study 1 can be found in Table 1. In the second column of Table 1, the densities are listed in ascending order. Lead has the highest number in that column and therefore has the greatest density.
Example Question #202 : Physics
Sound waves travel through a medium by mechanically disturbing the particles of that medium. As particles in the medium are displaced by the sound wave, they in turn act upon neighboring particles. In this fashion, the wave travels through the medium through a parallel series of disturbed particles. Like in other forms of motion, the rate at which the sound wave travels can be measured by dividing the distance over which the wave travels by the time required for it to do so.
Study 1
A group of students hypothesizes that the velocity of sound is dependent upon the density of the medium through which it passes. They propose that with more matter in a given space, each particle needs to travel a shorter distance to disturb the adjacent particles. Using two microphones and a high speed recording device, the students measured the delay from the first microphone to the second. They chose a variety of media, shown in Table 1, and measured the velocity of sound through each using their two-microphone setup. The results are found in Table 1.
Study 2
The students wanted to test their hypothesis by using the same medium at different densities. To do this, they heated pure water to various temperatures and repeated the procedure described in Study 1. Their results can be found in Table 2.
According to Study 2, water at which of the following temperatures yields the greatest velocity of sound?


Velocities of sound in water can be found in the third column of Table 2. The highest velocity listed in the table is 1,555 m/s. Temperatures are listed in the first column; this sound velocity occurs in water that is 80°C.
Example Question #1321 : Act Science
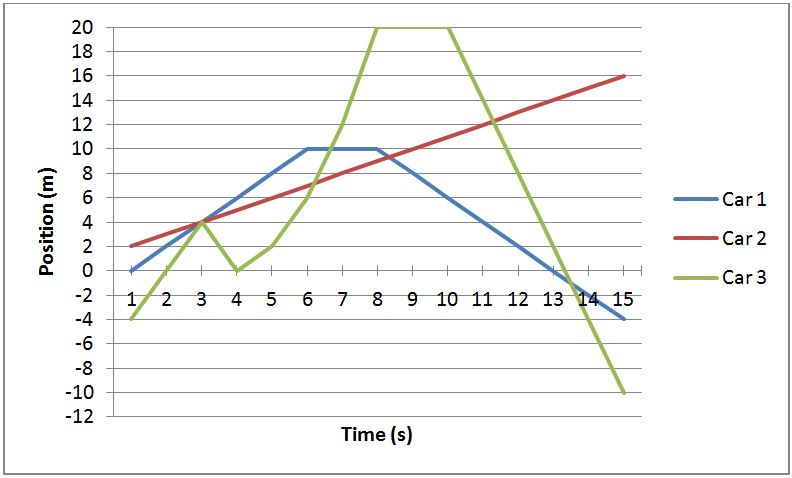
The graph below depicts the position of three different cars over a 15-second time interval.
At the point where all three cars meet, which car is traveling the fastest?
Cannot be determined.
Car 3.
They are all traveling at the same speed.
Car 2.
Car 1.
Car 3.
The three cars intersect at time = 3s. At this point, one can determine the speed (or velocity) of each car by looking how many meters the car travels per second. At time = 3, car 1 is traveling 1 m per second, car 2 is traveling 2 m per second, and car 3 is traveling 4 m per second. Another way of determining which car is the fastest is by looking at the slopes of each line. The car with the greatest slope is traveling the quickest.
Example Question #203 : Physics
The graph below depicts the position of three different cars over a 15-second time interval.
What is the speed of Car 1 at time = 7s?
Cannot be determined
2 m/s
1 m/s
0 m/s
4 m/s
0 m/s
At time = 7 s, Car 1 holds the same position as it did at 6 and 8 seconds, indicating that the car is not moving. If the car is not moving, then it has a speed of 0/s. One helpful method of determining the speed of a car on this graph, or any similar problem you may encounter, is to look at the slope of the graph. A slope of 0 means the car is not moving. A positive or negative slope indicates the car is in fact moving.
Example Question #204 : Physics
The graph below depicts the position of three different cars over a 15-second time interval.
If Car 3 continues to travel at it's current speed at t = 15 seconds, what will it's position be at time = 20s?
30 m
–30 m
–26 m
26 m
–34 m
–30 m
At t = 15 s, Car 3 is traveling 4 m/s and is traveling away from position 0 in the negative direction. At t = 15s, Car 3 is also at position = –10 m. Five seconds later it will travel 5s x 4 m/s = 20 m; therefore, it's new position will be (-10 + -20 = -30) –30 m.
Example Question #1323 : Act Science
A physicist wishes to study the trajectory of a ball launched horizontally. She varies parameters such as the launching velocity, starting height, and mass of the ball. For each trajectory, she records the time of flight (in seconds) and horizontal displacement (in meters). She assumes air resistance is negligible.
Figure 1
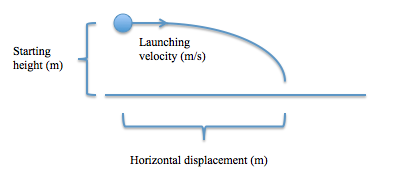
Using all of the data she collects, she constructs the following table:
Table 1
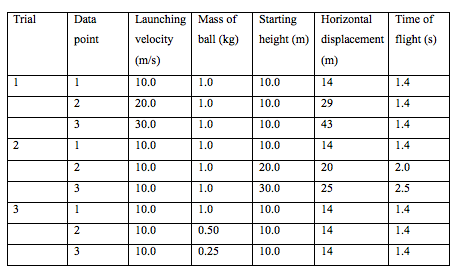
In Trial 1, if a fourth data point were collected in which the ball was thrown with a launching velocity of 40 m/s, what would be the approximate horizontal displacement in meters?
57
63
48
52
57
Looking at the table, we see that as the launching velocity is increased by 10 m/s in Trial 1, the horizontal displacement increases by about 14 meters.
Example Question #15 : How To Find Data Representation In Physics
A physicist wishes to study the trajectory of a ball launched horizontally. She varies parameters such as the launching velocity, starting height, and mass of the ball. For each trajectory, she records the time of flight (in seconds) and horizontal displacement (in meters). She assumes air resistance is negligible.
Figure 1
Using all of the data she collects, she constructs the following table:
Table 1
If all of trial 3 were redone with a launching velocity of 20 m/s instead of 10 m/s, then compared to the data for trial 3 presented in the table, the horizontal displacement for all data points would be which of the following?
Greater
Smaller
The same
Cannot be determined
Greater
Trial 3 shows us that the mass of the ball does not affect horizontal displacement, so mass can be ignored for this question. Trial 1 shows us that horizontal displacement increases with launching velocity, so we can reason that a higher launching velocity in Trial 3 would result in increased horizontal displacement.
Example Question #204 : Physics
Experiment 1
A scientist develops the following setup, shown in Figure 1 below, to study the charges of radioactive particles. A radioactive sample is placed into a lead box that has an open column such that the particles can only exit from one direction. A detector is placed in front of the opening. A metric ruler (centimeters (cm)), is aligned on the detector such that zero is directly in front of the opening of the column, with the positive values extending to the left and the negative values to the right. On the left side of the experimental setup, there is a device that generates a magnetic field that attracts positively charged particles and repels negatively charged particles.
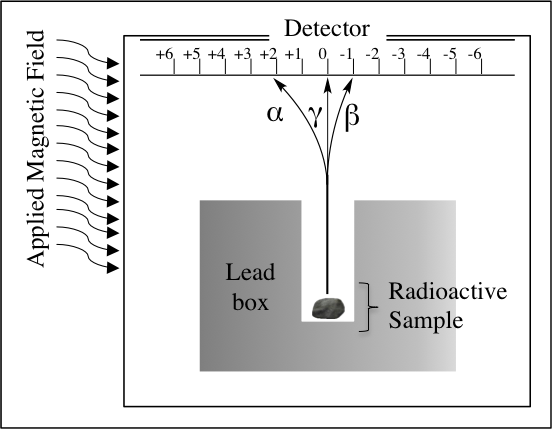
Figure 1.
The device detects particles in three different places: alpha, α; beta, β; and gamma, γ; as labeled in Figure 1. The paths these particles take from the source of radioactivity are shown.
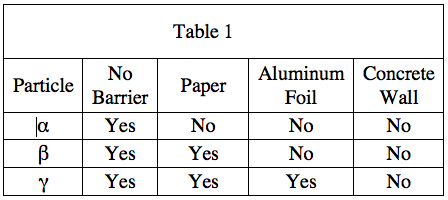
Experiment 2
A different scientist finds the following data, shown in Table 1, about the energies of the α, β, and γ particles by observing what kinds of materials through which the particles can pass. This scientist assumes that the ability of particles to pass through thicker and denser barriers is indicative of higher energy. Table 1 summarizes whether or not each type of particle was detected when each of the following barriers is placed between the radioactivity source and the detector. The paper and aluminum foil are both 1 millimeters thick, and the concrete wall is 1 meter thick.
Based on Experiment 1, which of the following particles must be positively charged?
β
α
all of the above
γ
α
As the Experiment 1 description states that the magnetic field attracts positively charge particles, and the alpha particle is the only particle with a trajectory bent toward the magnetic field, the answer must be α.
Example Question #1329 : Act Science
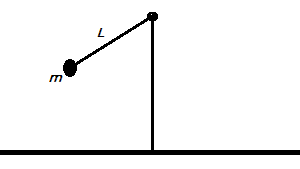
The period of a simple pendulum 
Student 1: The period of a pendulum depends on two factors: the mass of the pendulum's bob (the object swinging at the end of the pendulum) and the length of the pendulum. The height at which the pendulum is originally dropped does not affect the period 
Student 2: The period of a pendulum 
The two students ran a series of trials to measure the period of a simple pendulum using varying weights and lengths. The students did not measure height as a factor. The results of the trials can be seen in the table below:
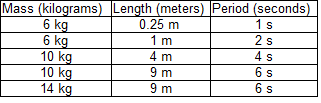
According to the data provided, what would we predict would happen if an experiment compared the periods of a pendulum made of a lead weight on a meter-long cord and a pendulum made of a tennis ball on a three-meter-long cord?
The period of the tennis ball pendulum would be shorter than the period of the lead ball pendulum.
The period of the tennis ball pendulum would be the same as the period of the lead ball pendulum.
The period of the tennis ball pendulum would be different than the period of the lead ball pendulum. We do not know whether it would be shorter or longer.
More information is necessary to make a prediction.
The period of the tennis ball pendulum would be longer than the period of the lead ball pendulum.
The period of the tennis ball pendulum would be longer than the period of the lead ball pendulum.
The table shows in its last two rows that changing the mass of the bob on a pendulum did not affect the pendulum's period. Therefore, only the length of the pendulum appears to affect the period. We can then ignore the lead ball versus the tennis ball, as the mass of each will not affect the periods of their respective pendulums. We can also see that if the length of a pendulum increases, the period of the pendulum also increases. Therefore, we would most likely predict that the period of the longer pendulum would be greater than the period of the shorter pendulum.


All ACT Science Resources

