DMCA Complaint
If you believe that content available by means of the Website (as defined in our Terms of Service) infringes one
or more of your copyrights, please notify us by providing a written notice (“Infringement Notice”) containing
the
information described below to the designated agent listed below. If Varsity Tutors takes action in response to
an
Infringement Notice, it will make a good faith attempt to contact the party that made such content available by
means of the most recent email address, if any, provided by such party to Varsity Tutors.
Your Infringement Notice may be forwarded to the party that made the content available or to third parties such
as
ChillingEffects.org.
Please be advised that you will be liable for damages (including costs and attorneys’ fees) if you materially
misrepresent that a product or activity is infringing your copyrights. Thus, if you are not sure content located
on or linked-to by the Website infringes your copyright, you should consider first contacting an attorney.
Please follow these steps to file a notice:
You must include the following:
A physical or electronic signature of the copyright owner or a person authorized to act on their behalf;
An identification of the copyright claimed to have been infringed;
A description of the nature and exact location of the content that you claim to infringe your copyright, in \
sufficient detail to permit Varsity Tutors to find and positively identify that content; for example we require
a
link to the specific question (not just the name of the question) that contains the content and a description of
which specific portion of the question – an image, a link, the text, etc – your complaint refers to;
Your name, address, telephone number and email address; and
A statement by you: (a) that you believe in good faith that the use of the content that you claim to infringe
your copyright is not authorized by law, or by the copyright owner or such owner’s agent; (b) that all of the
information contained in your Infringement Notice is accurate, and (c) under penalty of perjury, that you are
either the copyright owner or a person authorized to act on their behalf.
Send your complaint to our designated agent at:
Charles Cohn
Varsity Tutors LLC
101 S. Hanley Rd, Suite 300
St. Louis, MO 63105
Or fill out the form below:


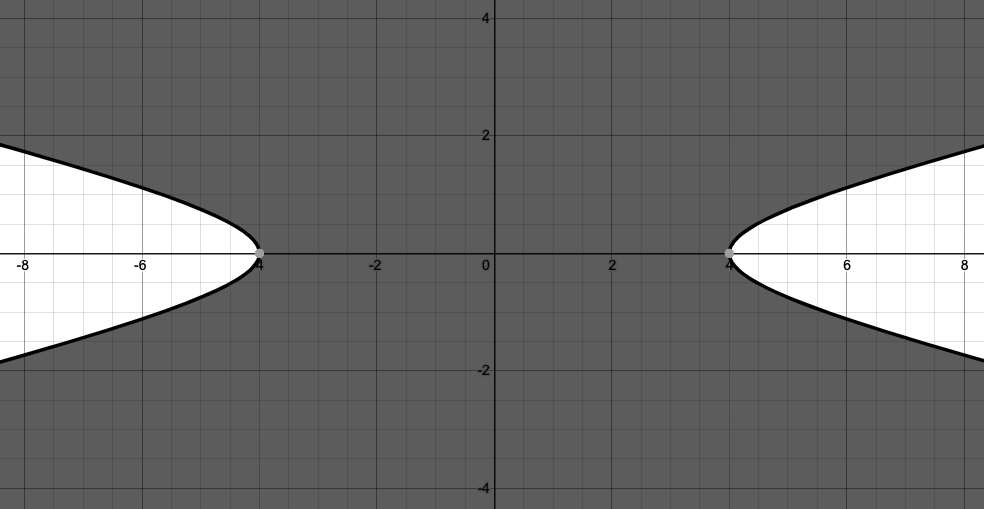
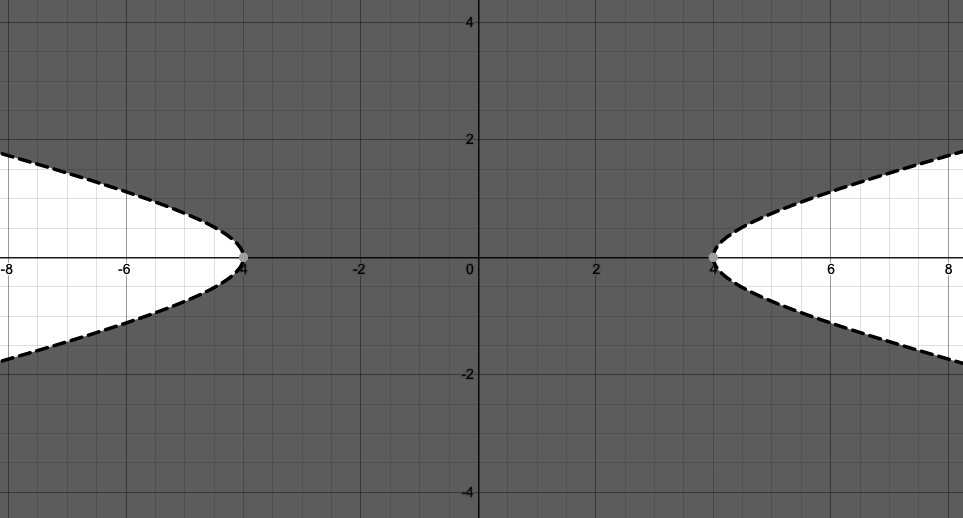
/9 - (x^2)/16 < 1")
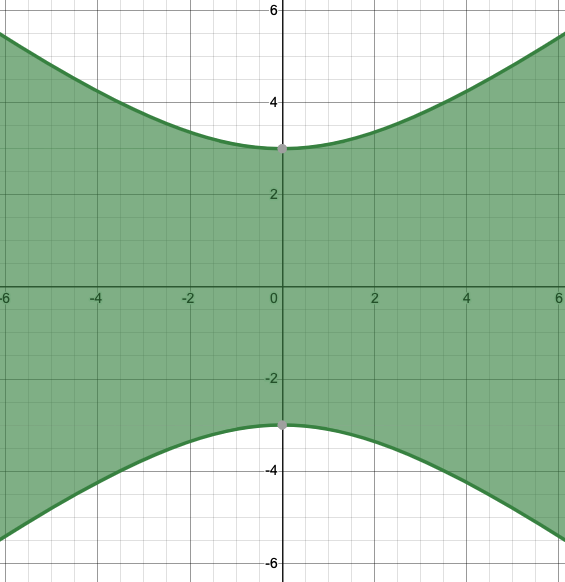
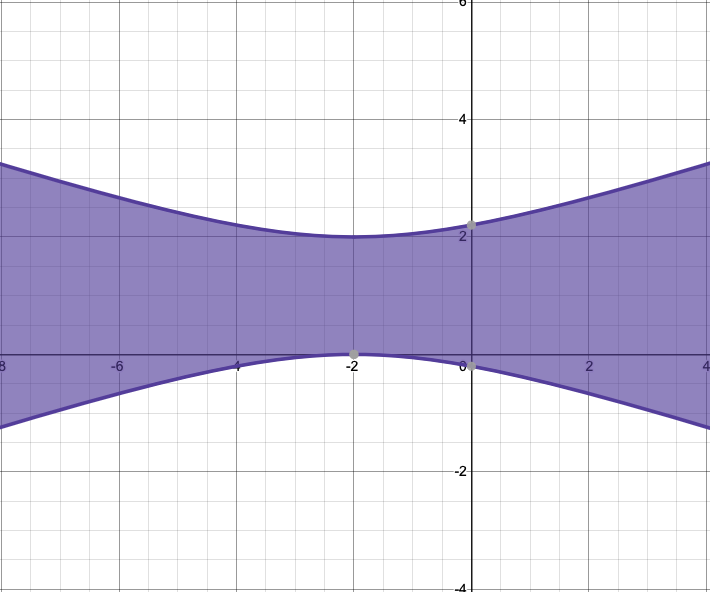
/16 - (y^2)/9 > 1")
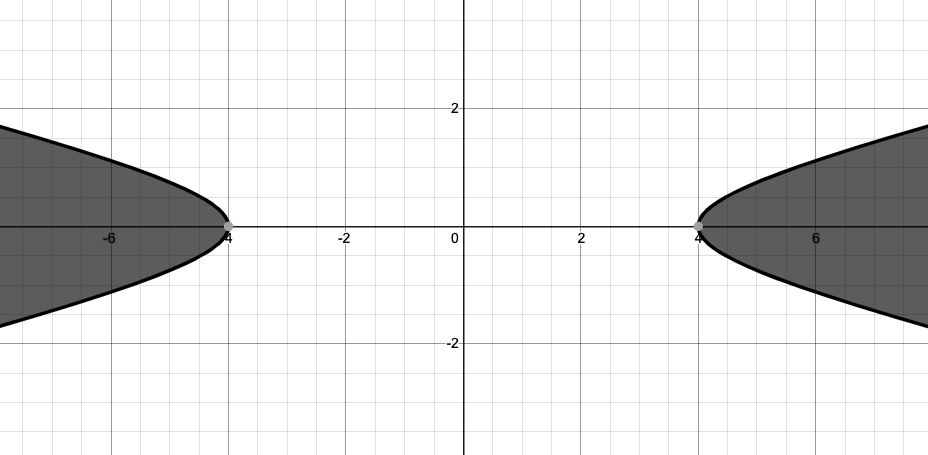
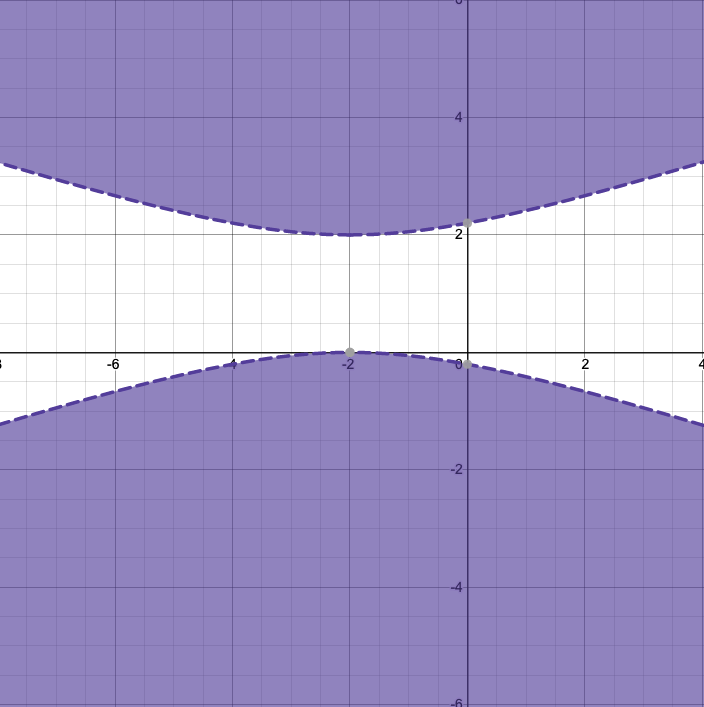
/9 - (x^2)/16 \leq 1")
/16 - (y^2)/9 \geq 1")
^2]/(a^2) - [(y-v)^2]/(b^2) = 1")
^2]/(b^2) - [(x-h)^2]/(a^2) = 1")


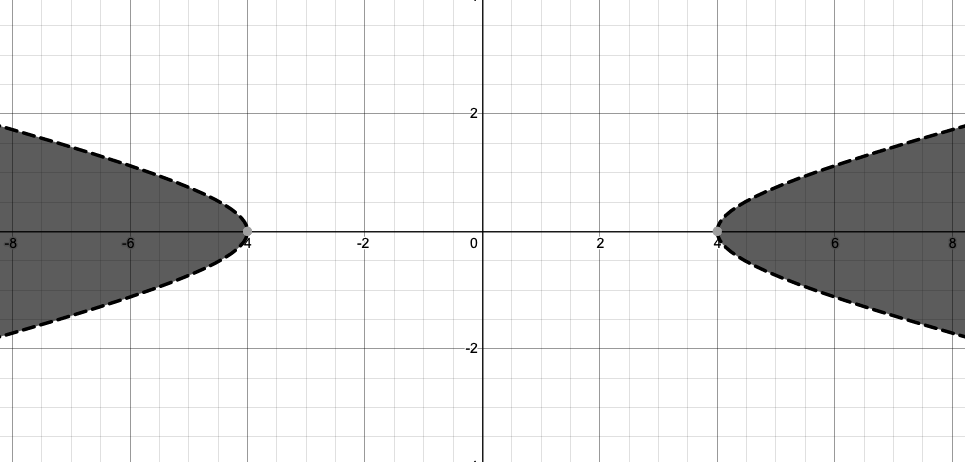
/16 - (y^2)/1 < 1")


^2]/(a^2) - [(y-v)^2]/(b^2) = 1")
^2]/(b^2) - [(x-h)^2]/(a^2) = 1")


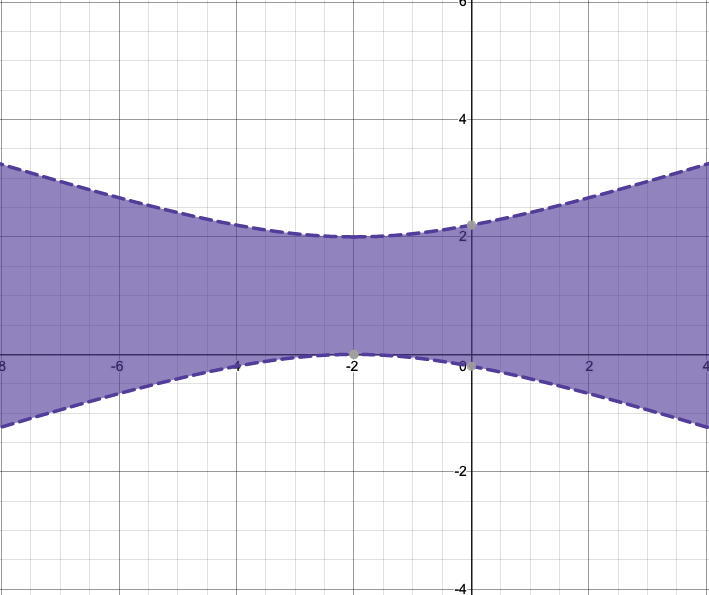
^2]/1 - [(x+2)^2]/9 \geq 1")
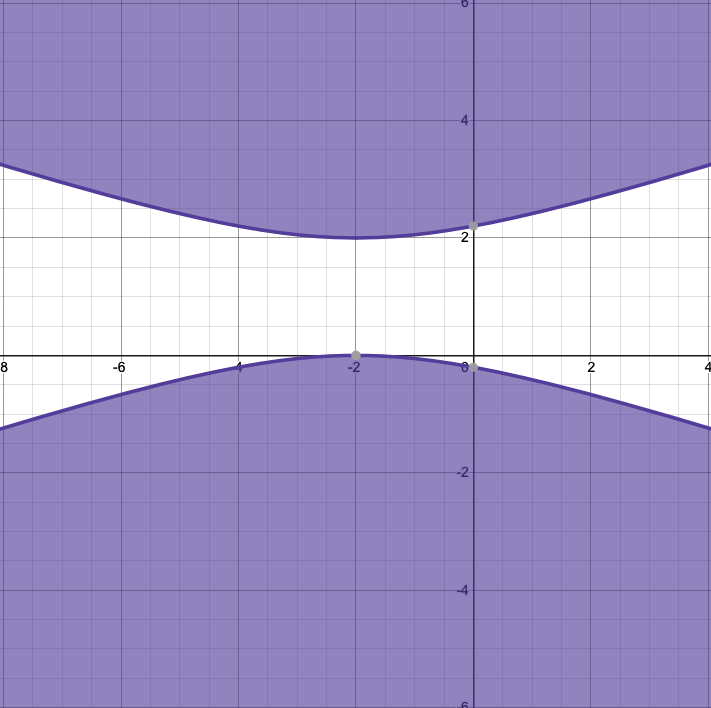


^2]/(a^2) - [(y-v)^2]/(b^2) = 1")
^2]/(b^2) - [(x-h)^2]/(a^2) = 1")


