Algebra II : Quadratic Inequalities
Study concepts, example questions & explanations for Algebra II


All Algebra II Resources
Example Questions
Example Question #136 : Quadratic Functions
Which equation would produce this graph:
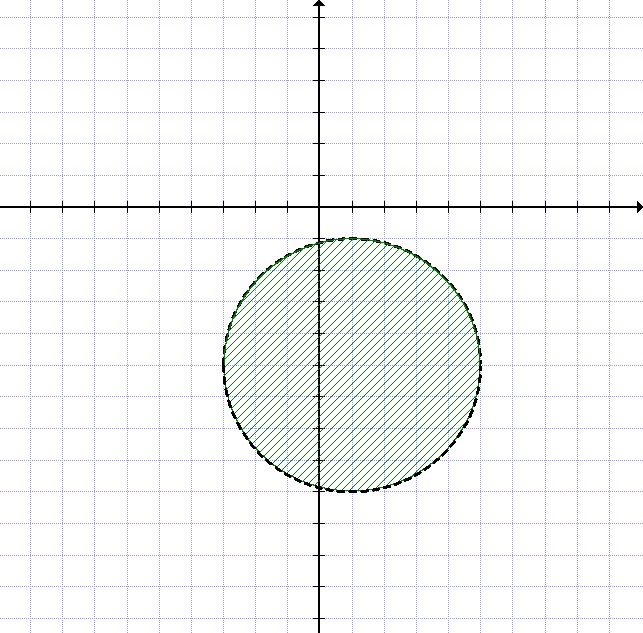
^2 + (y-5)^2 < 16")
^2 + (y+5)^2 < 16")
^2 + (y-5)^2 > 16")
^2 - (y-5)^2 > 4")
^2 + (y-5)^2 < 4")
The general equation of a circle is ^2 + (y-k)^2 = r^2")
")

In this case, the center is ")

^2 + (y+5)^2 = 16")
The circle is shaded on the inside, which means that choosing any point ")
^2 + (y+5)^2")

Therefore, our answer is ^2 + (y+5)^2 < 16")
Example Question #137 : Quadratic Functions
Which equation would match to this graph:
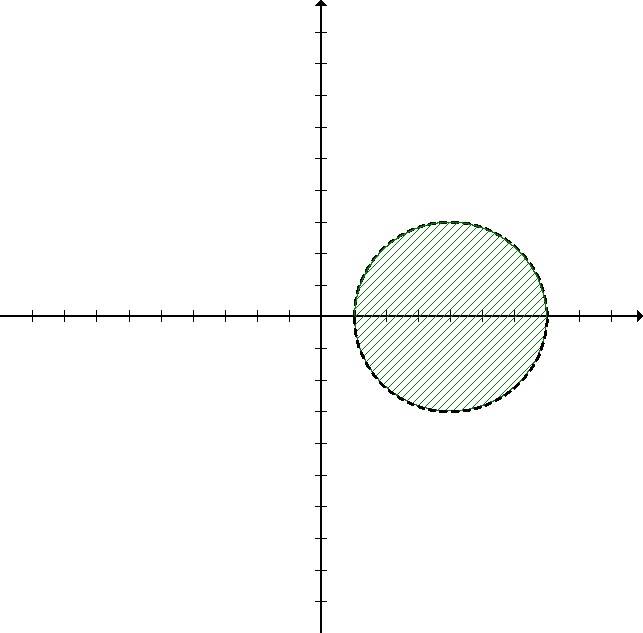

^2 + y^2 > 3")
^2 + y^2 < 9")
^2 > 9")
^2 - y^2 < 9")
The general equation for a circle is ^2 + (y-k)^2 = r^2")
")

In this case, the center is ")

^2 + (y-0)^2 = 3^2")
We can simplify this equation to: ^2 + y^2 = 9")
The circle is shaded on the inside, which means that choosing any point ")
^2 + y^2")

Therefore, our answer is ^2 + y^2 < 9")
Example Question #131 : Quadratic Functions
^2+(y-1)^2\geq25")
Given the above circle inequality, which point satisfies the inequality?
")
")
")
")
The left side of the equation must be greater than or equal to 25 in order to satisfy the equation, so plugging in each of the values for x and y, we see that:
^2+(4-1)^2= 6^2+3^2=36+9\geq25")
^2+(2-1)^2= 4^2+1^2=16+1\leq25")
^2+(0-1)^2= 1^2+1^2=1+1\leq25")
^2+(3-1)^2= 2^2+2^2=4+4\leq25")
The only point that satisfies the inequality is (7,4) since it yields an answer that is greater than or equal to 25.
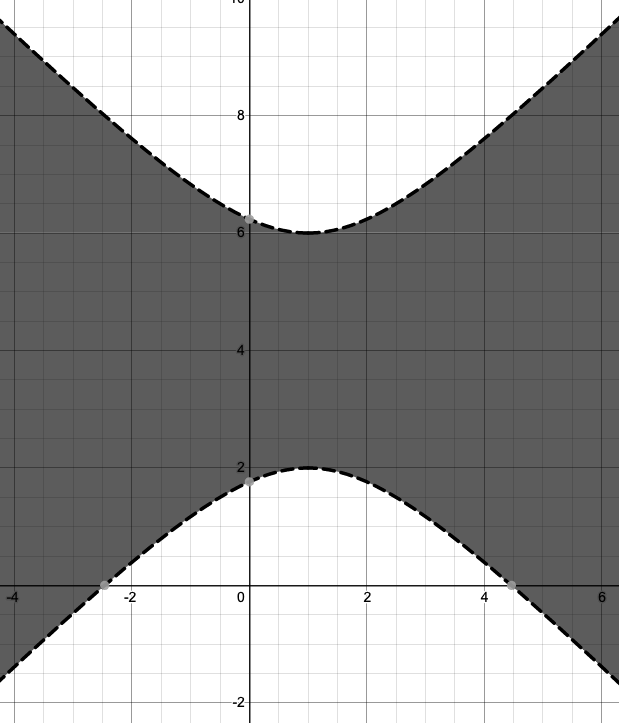
Example Question #1 : Graphing Hyperbolic Inequalities
Which inequality does this graph represent? 


The hyperbola in the question's graph is 
This could be discerned because it subtracts 


Test a point to tell which inequality is being used in the graph.
The point ")


Example Question #140 : Quadratic Functions
Which inequality does this graph represent? 


The hyperbola in the graph has y-intercepts rather than x-intercepts, so the equation must be in the form 
The y-intercepts are at 1 and -1, so the correct equation will have just 

The answer not must either be,


To see which, test a point in the shaded area.
For example, ")


Example Question #21 : Quadratic Inequalities
Which inequality does this graph represent?
^2]/4 - [(y-4)^2]/4 > 1")
^2]/4 - [(x-1)^2]/4 < 1")
^2]/4 - [(x-1)^2]/4 \leq 1")
^2]/4 - [(y-4)^2]/4 \geq 1")
The equation for a horizontal hyperbola is ^2]/(a^2) - [(y-v)^2]/(b^2) = 1")
^2]/(b^2) - [(x-h)^2]/(a^2) = 1")
")


Example Question #22 : Quadratic Inequalities
Which of the following inequalities is not hyperbolic?
^2]/9 + [(y-2)^2]/100 \leq 1")
^2]/16 - [(y+2)^2]/36 > 3")
^2]/4 - [(x-1)^2]/4 < 7")
^2]/49 - [(x-1)^2]/4 \geq 7")
The equation for a horizontal hyperbola is^2]/(a^2) - [(y-v)^2]/(b^2) = 1")
^2]/(b^2) - [(x-h)^2]/(a^2) = 1")
^2]/16 - [(y+2)^2]/36 > 3")
^2]/4 - [(x-1)^2]/4 < 7")
^2]/49 - [(x-1)^2]/4 \geq 7")
^2]/9 + [(y-2)^2]/100 \leq 1")
^2]/(a^2) + [(y-k)^2]/(b^2) = 1")
Example Question #541 : Functions And Graphs
Which of the following inequalities is not hyperbolic?
^2]/4 - 2[(y-3)^2]/16 \leq 1")
^2]/25 - [(y+4)^2]/4 <1")
]/4 - [(x-1)^2]/25 > 1")
^2]/16 - [(x-2)^2]/25 \geq 1")
The equation for a horizontal hyperbola is ^2]/(a^2) - [(y-v)^2]/(b^2) = 1")
^2]/(b^2) - [(x-h)^2]/(a^2) = 1")
^2]/4 - 2[(y-3)^2]/16 \leq 1")
^2]/16 - [(x-2)^2]/25 >= 1")
^2]/4 - 2[(y-3)^2]/16 \leq 1")
^2]/16 - [(x-2)^2]/25 \geq 1")
]/4 - [(x-1)^2]/25 > 1")
Example Question #24 : Quadratic Inequalities
Which inequality does this graph represent?
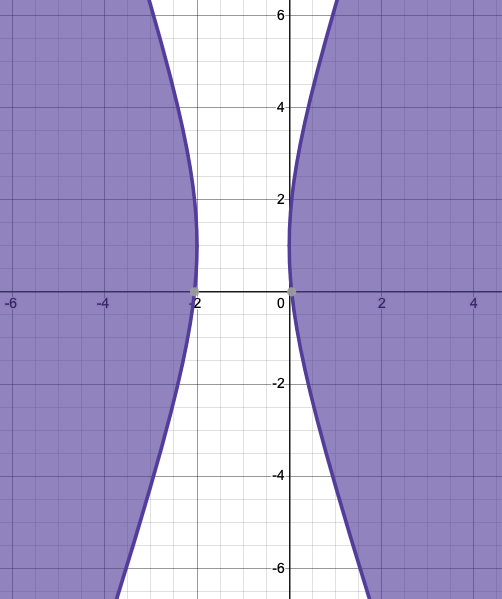
^2]/1 - [(y+1)^2]/9 \leq 1")
^2]/1 - [(y-1)^2]/9 > 1")
^2]/1 - [(y+1)^2]/9 < 1")
^2]/1 - [(y-1)^2]/9 \geq 1")
The equation for a horizontal hyperbola is ^2]/(a^2) - [(y-v)^2]/(b^2) = 1")
^2]/(b^2) - [(x-h)^2]/(a^2) = 1")


Example Question #25 : Quadratic Inequalities
Which inequality does this graph represent?
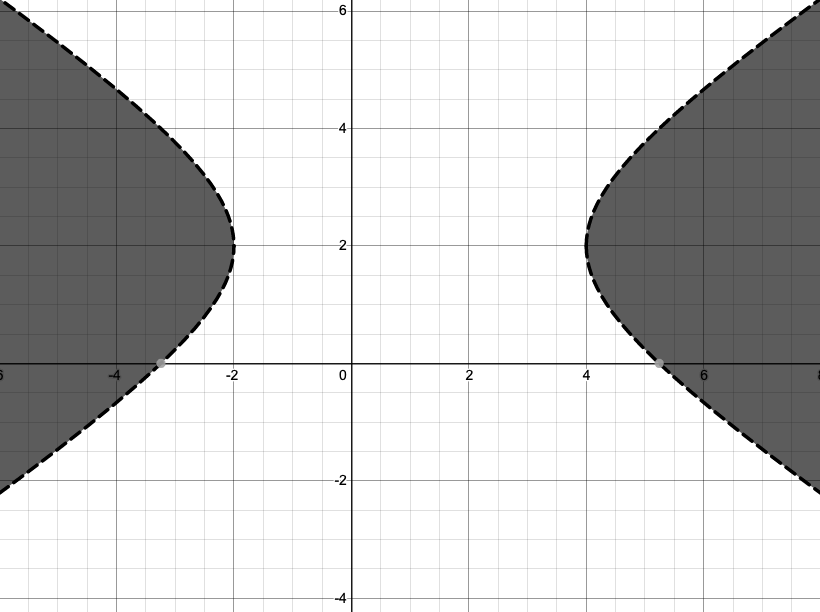
^2]/9 - [(y-2)^2]/4 < 1")
^2]/4 - [(x-1)^2]/9 < 1")
^2]/4 - [(x-1)^2]/9 > 1")
^2]/9 - [(y-2)^2]/4 > 1")
The equation for a horizontal hyperbola is ^2]/(a^2) - [(y-v)^2]/(b^2) = 1")
^2]/(b^2) - [(x-h)^2]/(a^2) = 1")

Certified Tutor

Certified Tutor

All Algebra II Resources

