Algebra II : Quadratic Inequalities
Study concepts, example questions & explanations for Algebra II


All Algebra II Resources
Example Questions
Example Question #1 : Graphing Parabolic Inequalities
Give the solution set of the inequality:

 \cup \left ( 5, \infty \right )")
")
 \cup \left ( 4, \infty \right )")
")
The inequality has no solution
Rewrite in standard form and factor:


(x+4) <0")
The zeroes of the polynomial are therefore 
")
")
")
")
Test 
^{2} - 20 < -5")


False; ")
")
Test


True; ")
")
Test 


False; ")
Since the inequality symbol is 
")
Example Question #1 : Graphing Parabolic Inequalities
Give the set of solutions for this inequality:

")
")
\cup(2, \infty)")
 \cup (2, \infty)")
This inequality has no solution.
The first step of questions like this is to get the quadratic in its standard form. So we move the 

This quadratic can easily be factored as(x+2)")
(x+2) <0")
and look at each of the factors individually. Recall that a negative number times a negative is a positive number. Therefore the boundaries of our solution interval is going to be when both of these factors are negative. ")

")


Our other boundary will be the other point when the product of the factors becomes positive. Remember that ")


")
Example Question #1 : Graphing Parabolic Inequalities
Solve for


When asked to solve for x we need to isolate x on one side of the equation.
To do this our first step is to subtract 7 from both sides.


From here, we divide by 4 to solve for x.


Example Question #3 : Graphing Parabolic Inequalities
Solve for


When asked to solve for y we need to isolate the variable on one side and the constants on the other side.
To do this we first add 9 to both sides.


From here, we divide by -12 to solve for y.


Example Question #4 : Graphing Parabolic Inequalities
The graphs for the lines 


The region 


Also, the region contains only 


Example Question #5 : Graphing Parabolic Inequalities
The graphs of the lines 


The region 


Similarly, the region contains only 


Example Question #1 : Quadratic Inequalities
Which of the following graphs correctly represents the quadratic inequality below (solutions to the inequalities are shaded in blue)?
^2")


To begin, we analyze the equation given: the base equation, 
^2")

To solve the inequality, we need to take a test point and plug it in to see if it matches the inequality. The only points that cannot be used are those directly on our parabola, so let's use the origin ")
^2")
Simplified as:

Which is not true, so the area inside of the parabola should be shaded, resulting in the following graph:
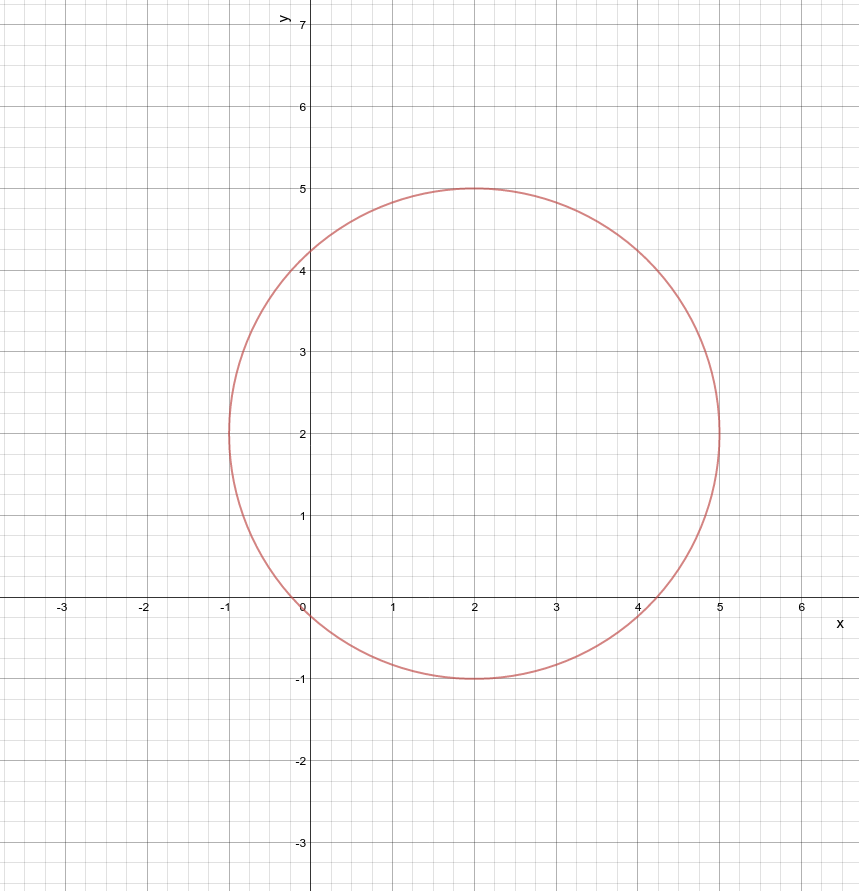
Example Question #1 : Graphing Circular Inequalities
Find an inequality for points on a graph that fall on or inside of a circle centered at ")

^2+(y-2)^2\leq 9")
^2+(y+2)^2 > 3^2")
^2+(y-3)^2\leq 2^2")

^2-(y+2)^2> 3")
The equation for a circle centered at point ")

^2+(y-b)^2=r^2")
")

^2+(y-2)^2\leq 3^2")
^2+(y-2)^2\leq 9")
Example Question #1 : Quadratic Inequalities
^2+(y-1)^2\geq25")
Given the above circle inequality, which point is not on the edge of the circle?
")
")
")
")
This is a graph of a circle with radius of 5 and a center of (1,1). The center of the circle is not on the edge of the circle, so that is the correct answer. All other points are exactly 5 units away from the circle's center, making them a part of the circle.
Example Question #521 : Functions And Graphs
^2+(y-1)^2\geq25")
Given the above circle inequality, does the center satisfy the equation?
Maybe
Can't tell
No
Yes
No
The center of the circle is ")
^2+(1-1)^2 \ngeq 25")
Since plugging in the center values gives us a false statement we know that our center does not satisfy the inequality.


All Algebra II Resources

