ACT Science : How to find experimental design in biology
Study concepts, example questions & explanations for ACT Science


All ACT Science Resources
Example Questions
Example Question #41 : How To Find Experimental Design In Biology
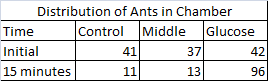
A researcher studies the olfactory (scent-related) senses of the giant forest ant, Camponotus gigas. The researcher places 120 ants in a three-chambered cell. The cell has an end section with a cotton ball soaked in a saline solution and another end with a cotton ball soaked in a glucose solution. The ants are placed in the middle and timed for 15 minutes. Their initial and final positions in the cell are recorded (see Table 1). The researcher's null hypothesis states that the distribution of ants across the three chambers will be equal to one another. In other words, the glucose solution will have no effect and there will be no significant difference in the distribution of the insects.
Table 1
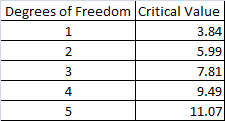
The researcher decides to perform a statistical test known as a Chi-squared test of independence to interpret the experiment's results. The test is performed by calculating a Chi-squared statistic by utilizing observed and expected values for distribution (see Table 2). If the sum of the Chi-squared test statistic is higher than the critical value, then the null hypothesis can be rejected. This indicates that the distribution of insects is not random and the variable in question has a pronounced effect on the subjects. A critical value is calculated by determining the degrees of freedom, which in this experiment is equal to the number of categories in the study minus one, and then locating the proper number on a table (see Table 3). There are three possible categories in this experiment: the glucose end, the control end (with the saline-solution soaked cotton ball), and middle portion of the chamber.
Table 2
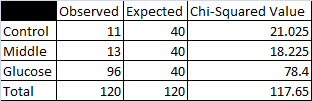
Table 3
What is the Chi-squared test statistic in this study?


Table 2 shows the Chi-squared information for this experiment. The total of the Chi-squared values is the test statistic, 
Example Question #42 : How To Find Experimental Design In Biology
A researcher studies the olfactory (scent-related) senses of the giant forest ant, Camponotus gigas. The researcher places 120 ants in a three-chambered cell. The cell has an end section with a cotton ball soaked in a saline solution and another end with a cotton ball soaked in a glucose solution. The ants are placed in the middle and timed for 15 minutes. Their initial and final positions in the cell are recorded (see Table 1). The researcher's null hypothesis states that the distribution of ants across the three chambers will be equal to one another. In other words, the glucose solution will have no effect and there will be no significant difference in the distribution of the insects.
Table 1
The researcher decides to perform a statistical test known as a Chi-squared test of independence to interpret the experiment's results. The test is performed by calculating a Chi-squared statistic by utilizing observed and expected values for distribution (see Table 2). If the sum of the Chi-squared test statistic is higher than the critical value, then the null hypothesis can be rejected. This indicates that the distribution of insects is not random and the variable in question has a pronounced effect on the subjects. A critical value is calculated by determining the degrees of freedom, which in this experiment is equal to the number of categories in the study minus one, and then locating the proper number on a table (see Table 3). There are three possible categories in this experiment: the glucose end, the control end (with the saline-solution soaked cotton ball), and middle portion of the chamber.
Table 2
Table 3
Suppose a researcher calculates a Chi-squared test statistic of 

The researcher should fail to reject the null hypothesis.
The researcher should reject the null hypothesis.
None of the other answer choices is correct.
The reseacher should support the null hypothesis.
The researcher should reject the null hypothesis.
In this case, the test statistic is greater than the critical value. The second paragraph of the passage states that the null hypothesis is rejected when the test statistic is greater than the critical value. The researcher should reject the null hypothesis.
Example Question #43 : How To Find Experimental Design In Biology
A researcher studies the olfactory (scent-related) senses of the giant forest ant, Camponotus gigas. The researcher places 120 ants in a three-chambered cell. The cell has an end section with a cotton ball soaked in a saline solution and another end with a cotton ball soaked in a glucose solution. The ants are placed in the middle and timed for 15 minutes. Their initial and final positions in the cell are recorded (see Table 1). The researcher's null hypothesis states that the distribution of ants across the three chambers will be equal to one another. In other words, the glucose solution will have no effect and there will be no significant difference in the distribution of the insects.
Table 1
The researcher decides to perform a statistical test known as a Chi-squared test of independence to interpret the experiment's results. The test is performed by calculating a Chi-squared statistic by utilizing observed and expected values for distribution (see Table 2). If the sum of the Chi-squared test statistic is higher than the critical value, then the null hypothesis can be rejected. This indicates that the distribution of insects is not random and the variable in question has a pronounced effect on the subjects. A critical value is calculated by determining the degrees of freedom, which in this experiment is equal to the number of categories in the study minus one, and then locating the proper number on a table (see Table 3). There are three possible categories in this experiment: the glucose end, the control end (with the saline-solution soaked cotton ball), and middle portion of the chamber.
Table 2
Table 3
When does a researcher reject the null hypothesis in a Chi-squared test of independence?
It is rejected when the test statistic is less than the critical value.
It is rejected when the test statistic is the same as the critical value.
It is rejected when the test statistic is greater than the critical value.
None of the other choices would warrant the rejection of the null hypothesis.
It is rejected when the test statistic is greater than the critical value.
The second paragraph states that the null hypothesis is rejected when the test statistic is greater than the critical number. This indicates that the populations differ from each other and that the independant variable has a pronounced effect.
Example Question #44 : How To Find Experimental Design In Biology
A researcher studies the olfactory (scent-related) senses of the giant forest ant, Camponotus gigas. The researcher places 120 ants in a three-chambered cell. The cell has an end section with a cotton ball soaked in a saline solution and another end with a cotton ball soaked in a glucose solution. The ants are placed in the middle and timed for 15 minutes. Their initial and final positions in the cell are recorded (see Table 1). The researcher's null hypothesis states that the distribution of ants across the three chambers will be equal to one another. In other words, the glucose solution will have no effect and there will be no significant difference in the distribution of the insects.
Table 1
The researcher decides to perform a statistical test known as a Chi-squared test of independence to interpret the experiment's results. The test is performed by calculating a Chi-squared statistic by utilizing observed and expected values for distribution (see Table 2). If the sum of the Chi-squared test statistic is higher than the critical value, then the null hypothesis can be rejected. This indicates that the distribution of insects is not random and the variable in question has a pronounced effect on the subjects. A critical value is calculated by determining the degrees of freedom, which in this experiment is equal to the number of categories in the study minus one, and then locating the proper number on a table (see Table 3). There are three possible categories in this experiment: the glucose end, the control end (with the saline-solution soaked cotton ball), and middle portion of the chamber.
Table 2
Table 3
When does a researcher fail to reject the null hypothesis of a Chi-squared test of independence?
None of these choices would permit one to fail to reject the null hypothesis.
It is not rejected when the test statistic is slightly greater than the critical value.
It is not rejected when the test statistic is far greater than the critical values.
It is not rejected when the test statistic is less than or equal to the critical value.
It is not rejected when the test statistic is less than or equal to the critical value.
The null hypothesis is not rejected when the test statistic is less than or equal to the critical value. The second paragraph outlines the laws that allow one to reject or fail to reject a null hypothesis in the Chi-squared test of independence. If the test statistic is greater than the critical value, then the null hypothesis is rejected. This means that one fails to reject the null hypothesis when the reverse is true, and the test statistic is equal to or less than the critical value.
Example Question #45 : How To Find Experimental Design In Biology
A researcher studies the olfactory (scent-related) senses of the giant forest ant, Camponotus gigas. The researcher places 120 ants in a three-chambered cell. The cell has an end section with a cotton ball soaked in a saline solution and another end with a cotton ball soaked in a glucose solution. The ants are placed in the middle and timed for 15 minutes. Their initial and final positions in the cell are recorded (see Table 1). The researcher's null hypothesis states that the distribution of ants across the three chambers will be equal to one another. In other words, the glucose solution will have no effect and there will be no significant difference in the distribution of the insects.
Table 1
The researcher decides to perform a statistical test known as a Chi-squared test of independence to interpret the experiment's results. The test is performed by calculating a Chi-squared statistic by utilizing observed and expected values for distribution (see Table 2). If the sum of the Chi-squared test statistic is higher than the critical value, then the null hypothesis can be rejected. This indicates that the distribution of insects is not random and the variable in question has a pronounced effect on the subjects. A critical value is calculated by determining the degrees of freedom, which in this experiment is equal to the number of categories in the study minus one, and then locating the proper number on a table (see Table 3). There are three possible categories in this experiment: the glucose end, the control end (with the saline-solution soaked cotton ball), and middle portion of the chamber.
Table 2
Table 3
What is the null hypothesis for the study?
None of the other answer choices is representative of the null hypothesis.
The ants will favor the glucose portion of the cell.
The ants' distribution will be equal across all three chambers.
The ants will favor the saline portion of the cell.
The ants' distribution will be equal across all three chambers.
The null hypothesis for this experiment is that the ants' distribution will be equal across all three chambers. The null hypothesis is a statement of no difference. At the end of the first paragraph the null hypothesis is stated. It says that the ants distribution across the chambers will be equal to one another. This means that the glucose solution will not effect the ants choice in chamber selection.
Example Question #41 : How To Find Experimental Design In Biology
Background
Plants take in nutrients through extensive root systems, as well as from the air through leaves or needles. Many coniferous evergreens are able to survive for a few weeks after being cut down due to their water-saving needles.
A group of students investigated the properties of several types of coniferous evergreens once they had been extracted from their environments. The students compared the length of time before needles (modified leaves) began to fall from the trees. They placed recently severed, seven-foot trees in spaces with controlled temperature and environmental conditions, and then monitored them closely over several days.
Experiment 1
The students placed representative samples of several varieties of coniferous evergreen in a controlled environment: 20°C, 1 atm, and 35% humidity. They recorded the number of days before needles began to fall for each species.
Results: Experiment 1
|
Species Name |
Days Before Needle Drop |
|
Grand Fir |
28 |
|
Virginia Pine |
29 |
|
Douglas Fir |
35 |
|
Pinyon Pine |
32 |
Experiment 2
The students used the Douglas Fir to conduct a second experiment. They placed new trees in enclosed spaces, varied the temperature and humidity of the trees' environments, and recorded the number of days before needles began to fall.
Results: Experiment 2
|
Temperature |
Humidity |
Days Before Needle Drop |
|
20°C |
55% |
37 |
|
30°C |
55% |
33 |
|
20°C |
45% |
36 |
|
30°C |
45% |
32 |
|
20°C |
65% |
39 |
|
30°C |
65% |
35 |
What is (are) the independent variable(s) in Experiment 2?
Temperature and time
Humidity and species of tree
Humidity
Species of tree
Temperature and humidity
Temperature and humidity
The species of tree used in Experiment 2 is constant (Douglas Fir). The students changed the temperature and the humidity of the enclosed environments, and observed the time until the trees began dropping their needles. This makes both temperature and humidity independent variables.
Example Question #47 : How To Find Experimental Design In Biology
Background
Plants take in nutrients through extensive root systems, as well as from the air through leaves or needles. Many coniferous evergreens are able to survive for a few weeks after being cut down due to their water-saving needles.
A group of students investigated the properties of several types of coniferous evergreens once they had been extracted from their environments. The students compared the length of time before needles (modified leaves) began to fall from the trees. They placed recently severed, seven-foot trees in spaces with controlled temperature and environmental conditions, and then monitored them closely over several days.
Experiment 1
The students placed representative samples of several varieties of coniferous evergreen in a controlled environment: 20°C, 1 atm, and 35% humidity. They recorded the number of days before needles began to fall for each species.
Results: Experiment 1
|
Species Name |
Days Before Needle Drop |
|
Grand Fir |
28 |
|
Virginia Pine |
29 |
|
Douglas Fir |
35 |
|
Pinyon Pine |
32 |
Experiment 2
The students used the Douglas Fir to conduct a second experiment. They placed new trees in enclosed spaces, varied the temperature and humidity of the trees' environments, and recorded the number of days before needles began to fall.
Results: Experiment 2
|
Temperature |
Humidity |
Days Before Needle Drop |
|
20°C |
55% |
37 |
|
30°C |
55% |
33 |
|
20°C |
45% |
36 |
|
30°C |
45% |
32 |
|
20°C |
65% |
39 |
|
30°C |
65% |
35 |
What would be an effective, relevant, experimental follow-up to this study?
Test the transpiration (water exchange) rate by placing the tree branches in a vacuum
Test which species grows the fastest by placing the trees in different temperatures
Test the transpiration (water exchange) rate by placing trees in sealed containers and measuring the atmospheric moisture
Test the carbon dioxide absorption rate by placing the trees in sealed containers and measuring the atmospheric carbon
Test the water absorption rate by placing the tree branches in a vacuum
Test the transpiration (water exchange) rate by placing trees in sealed containers and measuring the atmospheric moisture
Experiment 1 focused on the ability of conifers to absorb water and nutrients from their environments. Neither carbon dioxide nor growth rate are components of the original study, so those answers are not relevant. Placing the trees in a vacuum would prevent any water absorption, so that experiment would not give us any new information. By placing the trees in sealed containers, the students could measure the atmospheric moisture at different points, and then extrapolate the transpiration rate.
Example Question #48 : How To Find Experimental Design In Biology

Predator-prey relationships and mechanics are important tools for understanding the ecology of environments. Population cycles were first recorded in Canadian forests by fur trappers. Species interactions are important indicators of the health and economy of a natural environment. A twelve-year study of northern Canada revealed that snowshoe hares and lynxes share highly synchronized and predictable cycles. The lynx's predator populations mimic and mirrors that of their prey, the snowshoe hare. Two scientists express their views on these population patterns below.
Scientist 1
The observed relationship is best explained by predator-prey relationships and competition for resources. Consumer-resource interactions fluctuate independently of variation within the environment.
Scientist 2
The observed relationship is produced by environmental changes. Fluctuations in weather patterns and resources manipulate observed predator-prey relationships.
Could this data and the observed relationship be extrapolated to determine population dynamics of a small 70-acre farm in northern Canada.
Yes, it is safe to conclude that if a trend occurs over a large spatial scale then it will be mimicked over a smaller one.
No, the trend is dependant on a sample across a large spatial scale.
Yes, the trend is independant of a large spatial scale.
No, the farm contains variables such as humans and crops that could skew results.
No, the trend is dependant on a sample across a large spatial scale.
No, the trend is dependent on a sample across a large spatial scale.
This is the correct answer because the passage states that the interaction of species is dependent on a large spatial scale of thousands of meters. The answers that state otherwise are incorrect; furthermore, the other variables in the farm are possible issues, but not supported by the passage as definite issues. One cannot accurately determine the effects of these variables without observation.
Example Question #49 : How To Find Experimental Design In Biology
Predator-prey relationships and mechanics are important tools for understanding the ecology of environments. Population cycles were first recorded in Canadian forests by fur trappers. Species interactions are important indicators of the health and economy of a natural environment. A twelve-year study of northern Canada revealed that snowshoe hares and lynxes share highly synchronized and predictable cycles. The lynx's predator populations mimic and mirrors that of their prey, the snowshoe hare. Two scientists express their views on these population patterns below.
Scientist 1
The observed relationship is best explained by predator-prey relationships and competition for resources. Consumer-resource interactions fluctuate independently of variation within the environment.
Scientist 2
The observed relationship is produced by environmental changes. Fluctuations in weather patterns and resources manipulate observed predator-prey relationships.
What information is needed to help Scientist 2 to prove his point?
Data on food/water resources, weather patterns, and migration patterns of the species over the twelve year period
Data on weather patterns over the twelve year period
Data on food/water resources and weather patterns across the twelve year period
Data on food/water resources over the twelve year period
Data on food/water resources and weather patterns across the twelve year period
Data on food/water resources and weather patterns across the twelve year period.
The passage states that Scientist 2 believes that environmental factors such as food/water resources and weather patterns are the cause of the population growth synchronization. The scientist would not need to know the migration patterns of the species. This is not an environmental factor but a species-specific variable.
Example Question #50 : How To Find Experimental Design In Biology
A mycologist performed an experiment to determine the effect of methanol on the mold Neurospora crassa.
1,500 Neurospora spores were divided evenly into five groups of three large glass test tubes each. Then each test tube was filled with 5.0 mL of liquid nutrient solution and either 0 mL, 0.5 mL, 1.0 mL, 1.5 mL, or 2.0 mL of methanol. The tubes were placed in an incubator at 28oC overnight to germinate, and then their aerial growth was marked beginning the next morning and every twelve hours thereafter for two days.
Table 1 shows the average growth data with 


Based on the description of the experiment, which of the following aspects of the experimental design can you infer were not held constant?
The incubation temperature
The concentration of nutrients in each tube
The number of spores in each tube
The amount of nutrients in each tube
The concentration of nutrients in each tube
You know that each tube was filled with the same amount of nutrients, but then different volumes of methanol were added to different tubes, thus changing the concentration of nutrients in each tube.


All ACT Science Resources

