ACT Science : How to find experimental design in biology
Study concepts, example questions & explanations for ACT Science


All ACT Science Resources
Example Questions
Example Question #61 : How To Find Experimental Design In Biology
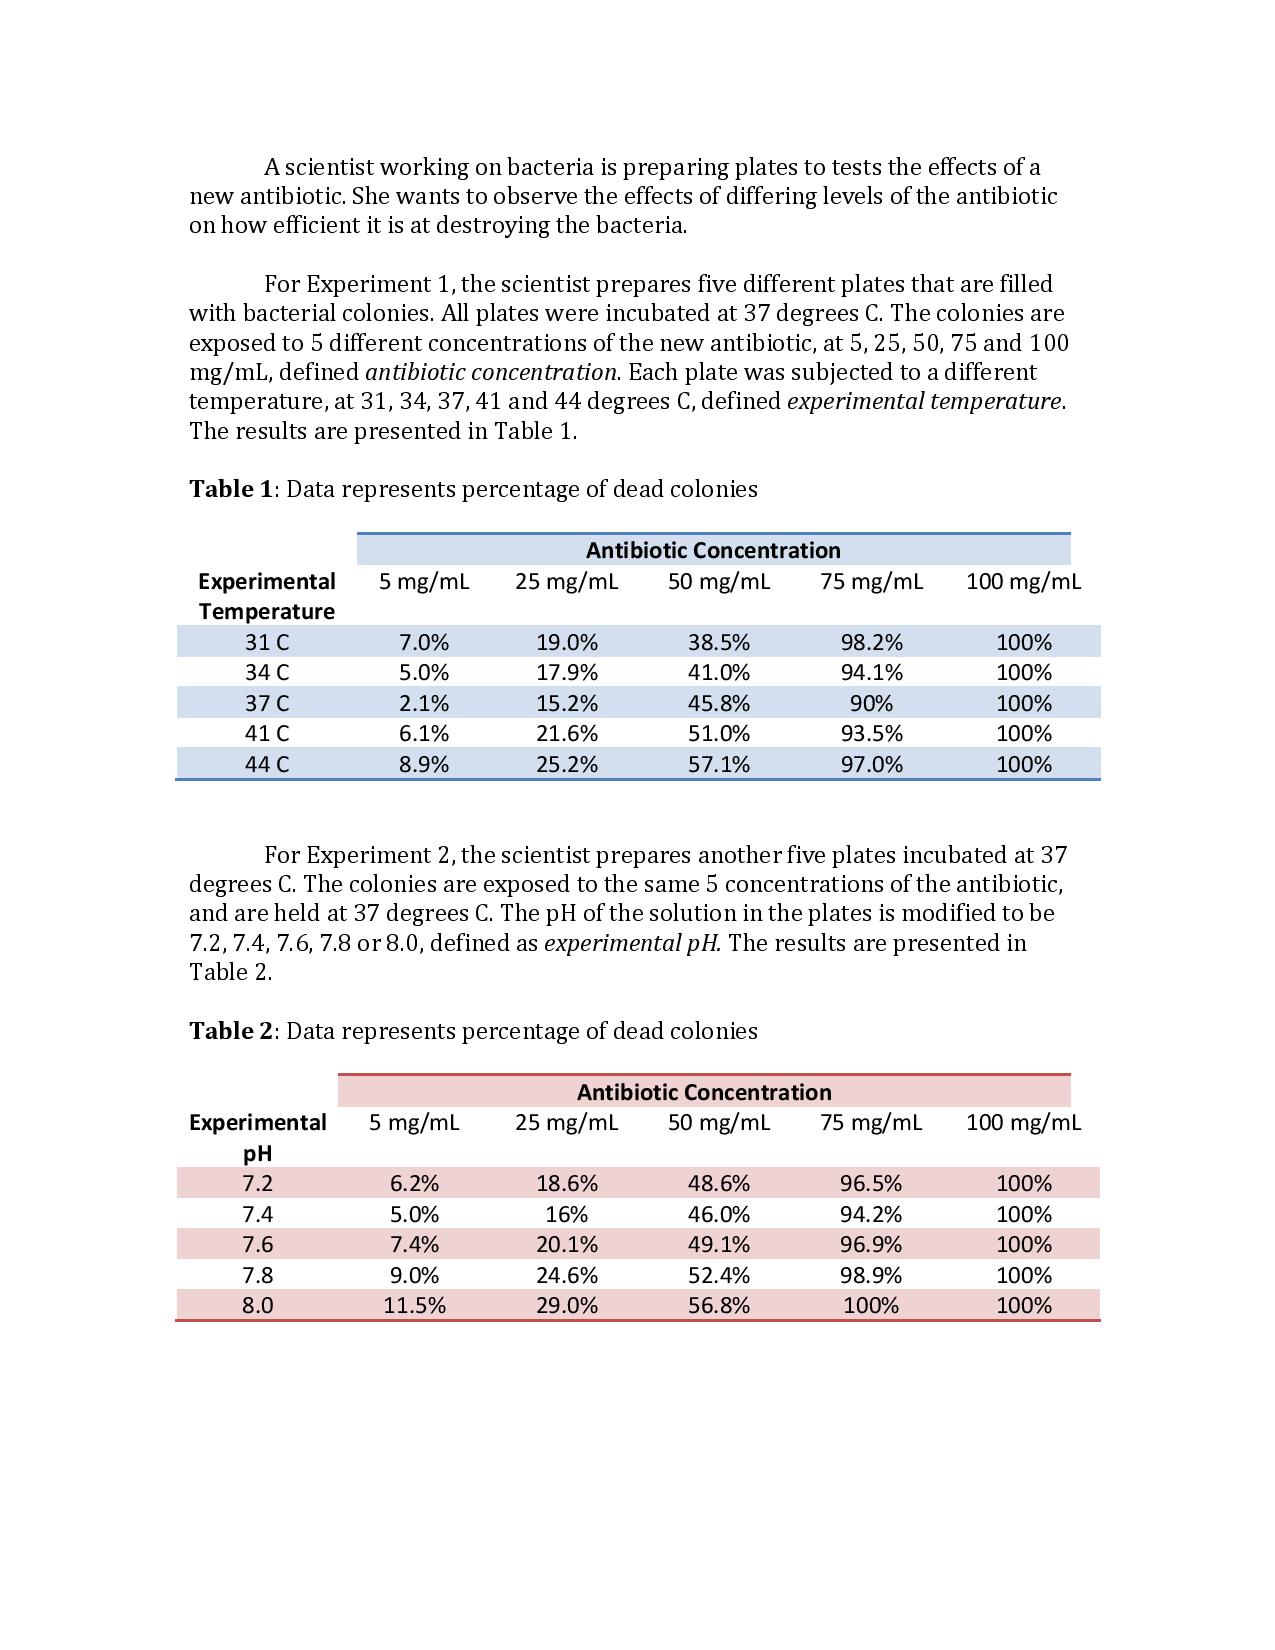
How does the experimental design of Experiment 2 differ from Experiment 1?
The experimental pH is held constant
The bacterial plates were prepared at a different incubation temperature
The antibiotic concentrations were allowed to vary
The experimental temperature is held constant
The experimental temperature is held constant
The difference in the experimental design from Experiment 2 to Experiment 1 is that the experimental temperature was held the same in Experiment 2. In Experiment 1, five different experimental temperatures were tested, but as listed in the explanation of Experiment 2, the experimental temperature was held at 37 degrees C.
Example Question #62 : How To Find Experimental Design In Biology
The mountain chickadee is a bird native to Colorado’s coniferous forests, preferring to live in areas 6,000 to 12,000 feet in elevation. They are a resident species, meaning they do not migrate south for the winter.
The mountain chickadee nests in coniferous trees, caves, snags and abandoned foxholes and eats insects, berries, and seeds. They tend to stay close to the breeding ground for most of their adult lives, and do not care for treeless valleys outside of the high country.
Researchers wish to know more about the nesting behaviors of these animals. For a calendar year, these researchers documented nesting patterns of the male chickadees in a coniferous forest in Northern Colorado. The researchers took note of both the season as well as the characteristics of the chickadee nests in order to establish a pattern. The results are documented below.
Mountain Chickadee Nesting and Survival Patterns June 2011- May 2012:
|
Summer |
Fall |
Winter |
Spring |
|
|
Location within Forest |
Coniferous tree branch |
Woodpecker hole |
Abandoned foxhole |
Coniferous tree cavity |
|
Average Time to Build Nest |
6 hrs |
8 hrs |
12 hrs |
8 hrs |
|
Average Duration of Stay |
8 weeks |
6 weeks |
4 weeks |
6 weeks |
|
Average Number of Offspring |
2 |
1 |
0 |
3 |
|
Average Death Rate of Bird |
1:15 |
1:12 |
1:8 |
1:12 |
What is the researchers' primary data collection method?
Survey
Experimentation
Census
Observation
Observation
These researchers observed the birds without manipulating their environment. There was no control group and therefore no experiment. A survey would suggest they asked the birds a series of questions. A census implies the same thing, so both are not valid. The only valid choice is observational study.
Example Question #63 : How To Find Experimental Design In Biology
The cells of multicellular organisms must be linked to each other through special structures called cellular junctions. A gap junction is a type of cellular junction, which allows for the passage of small molecules for fast coordination between cells. For example, cardiac cells in the heart and neurons in the brain rely on gap junctions. However, gap junctions are small and there is a limit to how large a molecule can be in order for it to pass through the gap junction.
An experiment is designed to see how large molecules can be to pass through a gap junction. A single layer of cells is grown in a petri dish. A single cell is then injected with a dye labeled with a fluorescent molecule. Researchers observe the following:
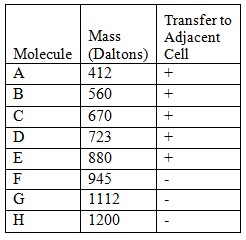
Based on the experiment, which of the following molecules would most likely pass through a gap junction?
A molecule with a mass of 900 Daltons
A molecule with a mass of 800 Daltons
A molecule with a mass of 950 Daltons
A molecule with a mass of 1000 Daltons
A molecule with a mass of 800 Daltons
A molecule with a mass of 800 Daltons is expected to pass through the gap junction. While a molecule of 900 Daltons may possibly pass, we cannot be sure of this based on our limited data.
Example Question #64 : How To Find Experimental Design In Biology
Researchers at a biotechnology company have just developed a new immortal line of mammalian cells derived from raccoon hair follicles. They dub these cells RHF and note that they appear particularly resistant to environmental stressors in initial experiments. They design a set of experiments to test the limits of the RHF cell line.
Experiment 1: The scientists inoculate 5 identical flasks containing growth media with samples of the RHF cells. The flasks are then incubated in separate incubators at varying temperatures. The flasks are sampled daily for cell density to analyze growth of the cells, yielding these results:
| Cell Density (million cells per mL) | |||||||
| Day | |||||||
| Temperature | 1 | 2 | 3 | 4 | 5 | 6 | 7 |
| 32 °C | 0.1 | 0.1 | 0.3 | 0.5 | 0.9 | 1.6 | 2.5 |
| 37 °C | 0.1 | 0.2 | 0.4 | 0.8 | 1.5 | 3.3 | 6.3 |
| 42 °C | 0.1 | 0.2 | 0.4 | 0.7 | 1.3 | 2.2 | 4.1 |
| 47 °C | 0.1 | 0.1 | 0.2 | 0.3 | 0.5 | 0.9 | 1.7 |
| 52 °C | 0.1 | 0 | 0 | 0 | 0 | 0 | 0 |
Experiment 2: The scientists produce 5 separate batches of cell growth media containing various amounts of salt to raise the osmolality of the solution. They inoculate 5 flasks, each with various osmolalities, then incubate the flasks at 37 °C for seven days. The flasks are sampled daily for cell density, yielding these results:
| Cell Density (million cells per mL) | |||||||
| Day | |||||||
| Osmolality (mOsm/kg) | 1 | 2 | 3 | 4 | 5 | 6 | 7 |
| 310 | 0.1 | 0.2 | 0.4 | 0.8 | 1.5 | 3.3 | 6.3 |
| 340 | 0.1 | 0.2 | 0.3 | 0.7 | 1.4 | 2.8 | 4.9 |
| 380 | 0.1 | 0.2 | 0.3 | 0.6 | 1 | 1.8 | 3.5 |
| 420 | 0.1 | 0.1 | 0.2 | 0.3 | 0.5 | 0.8 | 1.4 |
| 460 | 0.1 | 0.1 | 0.1 | 0.2 | 0.2 | 0.3 | 0.4 |
How does the experimental design differ from Experiment 1 to Experiment 2?
Experiment 1 had varied osmalality.
Experiment 1 varied pH.
Experiment 1 has constant osmolality.
Experiment 1 has constant temperature.
There was no difference in experimental design.
Experiment 1 has constant osmolality.
The text notes that identical media was used in all trials for experiment 1, while experiment 2 had multiple forms of modified media with different osmolality. Media osmolality was therefore a constant in experiment 1, but a variable in experiment 2.
Example Question #65 : How To Find Experimental Design In Biology
A sports physician is conducting an experiment in which a competitive bicycle rider has her heart rate, oxygen content in blood, and blood lactate measured. The measurements are taken at resting, during easy, moderate, difficult, and very difficult exercise. The results are summarized in the table below. Please note that the oxygen content was normalized to the resting oxygen content.

What important variable should also be measured that is not included?
The height and weight of the bicyclist
Speed at which the exercise was performed
The brand of the oxygen concentration monitor
Duration of exercise
The type of bicycle used for the exercise
Duration of exercise
The speed at which the exercise is performed is not significant as the intensity of the workout is already being qualitatively described. The type of bicycle used does not impact the data recorded by the physician. The height and weight of the bicyclist does not provide vital information to the experiment. The duration of the workout is very important. For example, a workout of moderate intensity for hours could affect the oxygen content and the level of blood lactate in a similar manner to a difficult workout for only a few minutes. Therefore the correct answer is the duration of the workout.
Example Question #66 : How To Find Experimental Design In Biology
A botanist is trying to see the effects of temperature on a certain plant species. She prepares four identical plots of soil and runs a heating element through the soil so she can vary the temperature of each plot. After one month she harvests all of the plant biomass and records the temperature of each plot along with the biomass collected. The data are given in the table below.

Suppose the experimenter discovered that weeds had been growing in the plots and were not removed from the plant species of interest during biomass collection. Based on this information, the experimenter repeated the experiment, but this time was extra careful in removing weeds from the biomass. Which of the following is most likely to be true regarding the repeated experiment?
The temperature of plot A would be higher.
The recorded biomass for the repeated experiment will be lower than the biomass recorded from the original experiement.
The temperature of plot A would be lower.
Plants in plot A would grow faster due to the lack of weeds.
The total biomass in plot A would be higher.
The recorded biomass for the repeated experiment will be lower than the biomass recorded from the original experiement.
If the experimenter is more careful in removing weeds, then the measured plant biomass for the repeated experiment should be lower than the biomass for the original experiment because fewer weeds would be weighed with the plant the experimenter is interested in. The question does not say the experimenter would pull the weeds as the plants grew, nor do you have any information regarding the effect of the weeds on the growth of the species of interest so we cannot conclude that the plants in plot A would grow faster.
Example Question #67 : How To Find Experimental Design In Biology
Three different species of bacteria were grown in the laboratory. The experiment measured the effect of pH on the concentration of the three species of bacteria. The graphs below show the concentration of bacteria at different pH levels. Figure 2 shows the effect of pH on the concentration of a third bacterial strain, bacteria C.

Which statement, if true, would serve to weaken the experiment?
Bacteria A, bacteria B and bacteria C were grown in an environment of 30 degrees celsius
All of the answers listed would weaken the experiment
Bacteria A and bacteria B were grown over the course of 4 days
Bacteria A and bacteria B were grown on separate petri dishes
Bacteria C was grown on the same petri dish as bacteria A and bacteria B
Bacteria C was grown on the same petri dish as bacteria A and bacteria B
Referring to both Figure 1 and Figure 2, bacteria A and bacteria B show low concentrations in pH levels where bacteria C had high concentrations. Though the pH of the medium can still be concluded as an influential factor on bacterial concentration, the presence of bacteria C on the same petri dish can be seen as an additional factor influencing concentrations of bacteria A and bacteria B.
Example Question #68 : How To Find Experimental Design In Biology
An undergraduate biology student working in a lab was reading about the latest health epidemic in the United States concerning obesity. He recently learned in his biology class that an enzyme called fatty acid synthase (FAS) catalyzes the formation of fatty acids. Accumulation of these fatty acids then creates the adipose fatty tissue that individuals typically see in their belly or side-regions. He hypothesizes that by decreasing the rate that this enzyme produces fatty acids by administering an inhibitor will aid in reducing the storage of fats, helping to alleviate obesity. After gaining approval from the university's clinical trials and ethics committee, he gathered a group of 20 test subjects. With the help of his research director, he measured the baseline rate of FAS activity for all test subjects and the averaged rate after oral administrators of a placebo and three types of inhibitors at a concentration of 0.6M to four equally-sized groups. The data is shown in Table 1.

Table 1.
The student then wonders if a mixture of different inhibitors were to increase the effect in the subject. He again measured the averaged baseline FAS level of the subjects and then attempted administering a placebo and three different combinations of inhibitors to subjects in a second trial. The results are shown in Table 2.

Table 2.
A colleague of the researcher interpreted the results from Table 1 and 2 and suggested a third trial which would track the averaged weight change of the subjects over a 6-month period. The results are shown in Table 3.

Table 3.
The researcher noted that many of the test subjects had similar diets. Most had admitted that they regularly consumed foods high in saturated fats and sodium. How would this affect the interpretation results of the study if the purpose of this study were to create a viable treatment to prevent and treat obesity?
This would not affect the interpretation of the results because the type of diet is irrelevant to the study assuming the patients' have normal FAS activity.
Because the sample is biased toward people who consumed high-fat diets, it would skew the interpretation of the results if it were extrapolated to patients of the general population.
This is positively affects the interpretation of the study since it can be assumed that the general population has a diet similar to that of the test subjects.
None of these
This would not affect the interpretation of the results because this drug would be most likely administered to patients who ate high-fat diets.
Because the sample is biased toward people who consumed high-fat diets, it would skew the interpretation of the results if it were extrapolated to patients of the general population.
If the researchers are attempting to create a drug to prevent obesity for the general population, it must be shown to work across a broad group of test subjects. Administering the drug to a specific group (high-fat diet) may create biased and skewed results.
Example Question #69 : How To Find Experimental Design In Biology
An undergraduate biology student working in a lab was reading about the latest health epidemic in the United States concerning obesity. He recently learned in his biology class that an enzyme called fatty acid synthase (FAS) catalyzes the formation of fatty acids. Accumulation of these fatty acids then creates the adipose fatty tissue that individuals typically see in their belly or side-regions. He hypothesizes that by decreasing the rate that this enzyme produces fatty acids by administering an inhibitor will aid in reducing the storage of fats, helping to alleviate obesity. After gaining approval from the university's clinical trials and ethics committee, he gathered a group of 20 test subjects. With the help of his research director, he measured the baseline rate of FAS activity for all test subjects and the averaged rate after oral administrators of a placebo and three types of inhibitors at a concentration of 0.6M to four equally-sized groups. The data is shown in Table 1.
Table 1.
The student then wonders if a mixture of different inhibitors were to increase the effect in the subject. He again measured the averaged baseline FAS level of the subjects and then attempted administering a placebo and three different combinations of inhibitors to subjects in a second trial. The results are shown in Table 2.
Table 2.
A colleague of the researcher interpreted the results from Table 1 and 2 and suggested a third trial which would track the averaged weight change of the subjects over a 6-month period. The results are shown in Table 3.
Table 3.
How might the significance of this study be increased?
Conduct a third trial in which the student would vary the concentration of the inhibitors.
Conduct a third trial in which the combination of inhibitors would also be mixed with a placebo.
Recruit more subjects to the study.
Administer the placebo during the pre-treatment procedure and measure the baseline values.
Test only on subjects who currently have obesity.
Recruit more subjects to the study.
Increasing the power a of study is easily mediated by increasing the number of subjects. This would decrease the overall p-value and maximize the randomness of the sample.
Example Question #61 : How To Find Experimental Design In Biology
If a drug is administered intravenously (i.e. injected into a vein), then the concentration of the drug in the blood will rise and then reach a plateau. After some time, the body will begin to eliminate this drug from the bloodstream. During this elimination phase, ion pumps will actively transport some drugs from the blood into the tubules of the kidneys. Organic anion transporters (OAT) transport acids into the tubules of the kidney while organic cation transporters (OCT) transport bases into the tubules of the kidney. This mechanism, known as secretion, depends entirely on transporters and allows both acidic and basic drugs to be eliminated from the body.
Another process known as reabsorption can also occur in the kidneys. During reabsorption, drugs can be transported from the tubules of the kidney back into the blood. This process depends on the pH of the fluid in kidney tubules (e.g. the urine). At a low pH (i.e. acidic environment), acidic drugs are best reabsorbed. Conversely, at high pH (i.e. basic environment), basic drugs are best reabsorbed.
Experiment 1
The same drug was administered to various individuals. After some time elapsed, the rate of renal clearance (i.e. the rate of urine elimination from the body) was measured in each of the individuals. Subsequently, the pH of the urine was measured for each individual. The rate of renal clearance versus urinary pH was then plotted in the provided figure (each black dot represents a different individual).

Experiment 2
A scientist was able to engineer a mouse kidney that lacked organic anion transporters. She administered various drugs to the mouse and measured the rates of secretion. The data collected is located in the provided table.

Which of the following would be considered as the dependent variable in Experiment 2?
The amount of organic anion transporters in the mouse kidney
Reabsorption rate
The identity of the drug
Secretion rate
Secretion rate
The identity of the drug and its acidity are variables that the scientist manipulates. The secretion rate is changing in response to the drug; therefore, secretion would be the dependent variable. The amount of OAT in the kidney is held constant in this experiment.


All ACT Science Resources

