ACT Science : Chemistry
Study concepts, example questions & explanations for ACT Science


All ACT Science Resources
Example Questions
Example Question #71 : Chemistry
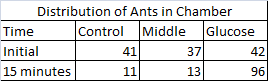
A researcher studies the olfactory (scent-related) senses of the giant forest ant, Camponotus gigas. The researcher places 120 ants in a three-chambered cell. The cell has an end section with a cotton ball soaked in a saline solution and another end with a cotton ball soaked in a glucose solution. The ants are placed in the middle and timed for 15 minutes. Their initial and final positions in the cell are recorded (see Table 1). The researcher's null hypothesis states that the distribution of ants across the three chambers will be equal to one another. In other words, the glucose solution will have no effect and there will be no significant difference in the distribution of the insects.
Table 1
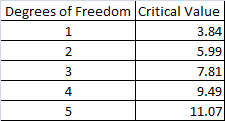
The researcher decides to perform a statistical test known as a Chi-squared test of independence to interpret the experiment's results. The test is performed by calculating a Chi-squared statistic by utilizing observed and expected values for distribution (see Table 2). If the sum of the Chi-squared test statistic is higher than the critical value, then the null hypothesis can be rejected. This indicates that the distribution of insects is not random and the variable in question has a pronounced effect on the subjects. A critical value is calculated by determining the degrees of freedom, which in this experiment is equal to the number of categories in the study minus one, and then locating the proper number on a table (see Table 3). There are three possible categories in this experiment: the glucose end, the control end (with the saline-solution soaked cotton ball), and middle portion of the chamber.
Table 2
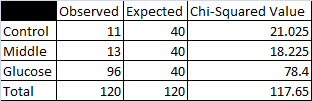
Table 3
What is the target organism of this study?
Tapinoma melanocephalum
Camponotus gigas
Protomognathus americanus
Harpegnathos saltator
Camponotus gigas
The first paragraph of the passage states that the target organism of the study is the ant species Camponotus gigas. The researcher was attempting to study the olfactory senses of the ants in response to a glucose food source. This is supported by the passage.
Example Question #1 : How To Find Experimental Design In Chemistry
During digestion, the energy in food is converted to energy the body can use. Scientists use calorimetry experiments to measure the calories, or energy, provided by food when it is digested or burned.
The relationship used to find the heat transferred energy ")


In this experiment, food was burned over a Bunsen burner under a can of 200 ml of water. The temperature change of the water and mass change of the food can be used to determine the calories in four different food items.
Table 1 shows the values of the change of mass of the food items, the change in temperature of the water and the energy. Table 2 shows the energy to mass ratio of three of those food items.
Table 1
Roasted Peanut Peanut Cracker Cheese Puff
Water Temp. Initial 23.9 °C 33.2 °C 40.3 °C 53.9 °C
Water Temp. Final 30.0 °C 40.9 °C 55.9 °C 62.8 °C
Food Mass Initial 0.69 g 0.61 g 3.21 g 1.22 g
Food Mass Final 0.38 g 0.21 g 0.91 g 0.48 g
Energy 1.22 Cal 1.54 Cal 3.12 Cal 1.78 Cal
Table 2
Sample Energy to Mass Ratio (Cal/g)
1 1.36
2 3.93
3 2.40
What is a controlled variable in this experiment?
The initial mass of the food items
The specific heat capacity of water
The specific heat capacity of the food items
The initial temperature of the water
The specific heat capacity of water
The specific heat capacity of the water is the only constant out of this group because the same water is used throughout the four samples. All of the other conditions are shown to change based on the values in Table 1. Additionally, maintaining a constant specific heat capacity in the water is essential for finding the calories in the food though this method.
Example Question #2 : How To Find Experimental Design In Chemistry
During digestion, the energy in food is converted to energy the body can use. Scientists use calorimetry experiments to measure the calories, or energy, provided by food when it is digested or burned.
The relationship used to find the heat transferred energy ")
In this experiment, food was burned over a Bunsen burner under a can of 200 ml of water. The temperature change of the water and mass change of the food can be used to determine the calories in four different food items.
Table 1 shows the values of the change of mass of the food items, the change in temperature of the water and the energy. Table 2 shows the energy to mass ratio of three of those food items.
Table 1
Roasted Peanut Peanut Cracker Cheese Puff
Water Temp. Initial 23.9 °C 33.2 °C 40.3 °C 53.9 °C
Water Temp. Final 30.0 °C 40.9 °C 55.9 °C 62.8 °C
Food Mass Initial 0.69 g 0.61 g 3.21 g 1.22 g
Food Mass Final 0.38 g 0.21 g 0.91 g 0.48 g
Energy 1.22 Cal 1.54 Cal 3.12 Cal 1.78 Cal
Table 2
Sample Energy to Mass Ratio (Cal/g)
1 1.36
2 3.93
3 2.40
Based on the information in Table 1, what variables must be measured in order to calculate the energy of the food samples?
Change in mass of the food sample alone
Change in mass and temperature of the water
Change in temperature of the water alone
Change in mass of the food and change in temperature of the water
Change in mass of the food and change in temperature of the water
Based on the given equation for calculating heat energy, the heat capacity of the water, change of mass of the material, and change in temperature of the material must be measured. However, because the heat capacity of water is consistent, it does not affect the measure of the different calorie measurements. Additionally, because the change in heat of the food samples must approximately equal the change in temperature of the food item due to their proximity, only the change in temperature of the water and change in mass of the food samples needs to be known. Also, this answer is given in the description of the experiment.
Example Question #74 : Chemistry
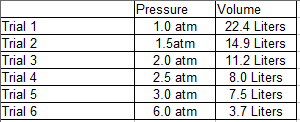
A student wants to perform an experiment that tests the relationship between the pressure of a gas and the volume it occupies. To perform this experiment, the student places a specific type of gas in a sealed chamber that can change pressure and that can adapt its volume to the gas within it. The chamber also adjusts to the changing pressure such that the temperature (which also has an effect on gas volume) does not change. The following data was obtained:
Based on the information in the passage, which variable(s) are or were held as constants?
Temperature
Size of chamber
Temperature and type of gas
Temperature, type of gas, and size of chamber
Type of gas
Temperature and type of gas
The correct answer is the temperature and the type of gas. Although technically the type of gas would not change the results of the experiment, it was still expressed explicitly in the passage that it was held constant. This is also true about the temperature. Although the chamber remains the same, it is stated in the text that the chamber adjusts to the gas such that it adapts to the volume of the gas within it. This implies that the shape of the chamber does not remain constant and is therefore changing from trial to trial. Therefore, we can eliminate any answer including "shape of the chamber" and choose the answer which includes both temperature and type of gas as variables held constant.
Example Question #75 : Chemistry
A student wants to perform an experiment that tests the relationship between the pressure of a gas and the volume it occupies. To perform this experiment, the student places a specific type of gas in a sealed chamber that can change pressure and that can adapt its volume to the gas within it. The chamber also adjusts to the changing pressure such that the temperature (which also has an effect on gas volume) does not change. The following data was obtained:
Based on the data obtained by the experiment, what can be said about the relationship between pressure (atm) and volume (liters)?
No consistent relationship is observable.
They are directly and exponentially related.
They are inversely and linearly related.
They are inversely and exponentially related.
They are directly and linearly related.
They are inversely and linearly related.
The correct answer is that they are inversely and linearly related. As we can see from the experimental data, as pressure doubles, the volume tends to be halved. This means that when one increases, the other decreases, demonstrating an inverse relationship. Additionally, because when one doubles, the other halves, we know that the relationship is linear. This is as opposed to exponential, in which the change in one variable would mean a change proportional to that change taken to a particular exponent. Such a relationship was not observed, leading us to the answer "inversely and linearly related."
Example Question #11 : How To Find Experimental Design In Chemistry
A brilliant but underpaid high school chemistry teacher, together with his former student, manufactures a chemical compound, which they sell for a large mark-up. Their set of reactions are given below:
(1) A + B + C + acid --> D
(2) D --> intermediate
(3) Intermediate --> E
(4) E + acid --> X
His student notes the following observations:
Observation 1) If a greater amount of B and C are used in the reaction, this yields no increased amount of product D.
Observation 2) At any given point, D, the intermediate, and E may co-exist in equal proportions. However, at higher temperatures, higher proportions of product E are noted.
Observation 3) The addition of a strong base can reverse reaction 4.
If reagent A was the limiting reagent, how might the student determine this?
Construct a table measuring amount of D produced at regular time intervals while holding A, B, and C constant.
Construct a table measuring amount of D produced at regular time intervals while holding A constants and varying amount of B and C produced.
Hold amount of A constant and increase amounts of B, C, and acid. Then plot againt amount of D produced.
Plot varied amounts of A used against amount of D produced, holding B, C, and acid in excess.
Plot varied amounts of A used against amount of D produced, holding B, C, and acid in excess.
The definition of limiting reagent means that the amount of product produced is directly correlated to the amount of limiting reagent available. While the option saying, "Hold amount of A constant and increase amounts of B, C, and acid. Then plot againt amount of D produced," may show that increased B, C, and acid has no effect in increasing the amount of D produced, it does not show that increasing A does. In contrast, the option holding B, C, and acid in excess, while increasing A, may show a direct increase in the amount of D produced. In this setting, there is no indication that time will be helpful in determining the role of A; rather, only using varied amounts of A while holding B, C, and acid in excess, can help determine if A, is in fact, the limiting reagent.
Example Question #754 : Act Science
There are two types of forces that occur with all substances on Earth. Intramolecular forces occur between atoms in a molecule, while intermolecular forces occur between neighboring molecules. Intermolecular forces can be dipole-dipole forces, hydrogen bonding, or London dispersion forces.
Professor 1:
Water molecules represent an example of hydrogen bonding due to the attraction between the hydrogen atoms and the oxygen atoms in the molecule. This strong dipole-dipole occurs due to lone pairs present on such atoms as Fluorine, Nitrogen, and Oxygen, which are able to pair more closely to the hydrogen atom in another nearby molecule. Water can be present in a solid, liquid, or gaseous state on Earth depending on the competition between the strength of intermolecular bonds and the thermal energy of the system. In 1873, a Dutch scientist, Van der Waals derived an equation that included both the force of attraction between the particles of a gas and the volume of the particles at high pressures. This equation led to a better fit for experimental data than the Ideal Gas Law.
Professor 2:
Water is the only substance on Earth that we routinely encounter as a solid, liquid, and gas. At low temperatures, the water molecules lock into a rigid structure, but as the temperature increases, the average kinetic energy of the water molecules increases and the molecules are able to move more creating its other natural states of matter. The higher the temperature, the more likely water is to be a gas. Water is proof of the kinetic theory, which assumes that there is no force of attraction between the particles of the gas state. The best fit for experimental data involving water in a gaseous form is found by using the Ideal Gas Law, since there is no interaction between the gaseous molecules. This law accounts for all of the forces that occur with gases on Earth.
Which of the following experiments could solve the debate between the two professors?
An experiment that measures the kinetic energy in various samples of water.
An experiment that tests various gases against the values found in the Ideal Gas Law.
An experiment involving one or more gases where the actual experimental results found are compared with the results found by both equations.
An experiment testing how strong the hydrogen bonding present in various samples of water in different states of matter are and comparing that to the kinetic energy present.
An experiment involving one or more gases where the actual experimental results found are compared with the results found by both equations.
The main argument between the two professors is regarding which equation- Van der Waals' or the Ideal Gas Law- is the most appropriate way to estimate experimental data.
An experiment that would resolve the conflict would be one that sets up a scenario involving one or more gases and compares the actual experimental results found with the results found by both equations. This way the equation that found results that were closer to the actual results measured in the experiment would be considered the "best fit" to use.
Example Question #761 : Act Science
Two scientists wanted to test the solubility of different substances. Solubility is a measure of how many moles of a given substance (known as the solute) can dissolve in a given volume of another substance (known as the solvent). The solvent can also be thought of as the substance present in greater amount, while the solute can be seen as the substance present in lesser amount. The scientists performed the following experiments to investigate this property.
Experiment 1
The scientists tested the number of moles of several substances that could be completely dissolved in 
Table 1

Experiment 2
In this experiment, the scientists wanted to test the solubility of 
Table 2

How did the procedures of the two experiments differ?
In Experiment 1, several solutes were tested, while Experiment 2 tested several solvents.
There was no difference between experimental procedures for Experiments 1 and 2.
In Experiment 1, several solvents were tested, while Experiment 2 tested several solutes.
In Experiment 1, temperature was held constant, while in Experiment 2, temperature was varied.
In Experiment 1, temperature was varied, while in Experiment 2, it was held constant.
In Experiment 1, several solutes were tested, while Experiment 2 tested several solvents.
This question requires a careful reading of the text, or a good understanding of the definition of solutes and solvents. We can eliminate the choices dealing with temperature, because a cursory glance at Table 1 and Table 2 reveals that temperature was varied in both experiments.
A solvent is the substance present in greater amount. In this passage, all our solvents are liquids.
A solute is the substance present in smaller amount. In this case, our solutes are solids.
In Experiment 1, several solids were tested, while in Experiment 2, only one solid was tested: 
Example Question #762 : Act Science
Two scientists wanted to test the solubility of different substances. Solubility is a measure of how many moles of a given substance (known as the solute) can dissolve in a given volume of another substance (known as the solvent). The solvent can also be thought of as the substance present in greater amount, while the solute can be seen as the substance present in lesser amount. The scientists performed the following experiments to investigate this property.
Experiment 1
The scientists tested the number of moles of several substances that could be completely dissolved in 
Table 1
Experiment 2
In this experiment, the scientists wanted to test the solubility of 
Table 2
Why did the scientists weigh the beakers before adding any solutes to them?
The scientists weighed the beakers beforehand in order to know how much of each solute to add.
The scientists weighed the beakers beforehand in order to make sure their beakers weren't damaged.
By weighing the beakers first, the scientists could find the added mass by subtracting the initial mass.
By weighing the beakers first, the scientists could make sure their balance was working properly.
By weighing the beakers first, the scientists could find the added mass by subtracting the initial mass.
When weighing out anything in chemistry, it is important to be very precise. Reading through the description of Experiment 1, we find the following: "The beakers were weighed before and after the additions and the difference in mass was calculated to be the added mass of the substance." This suggests that finding the mass of the beakers before adding any solute was done in order to find the mass that was added. By taking the difference between the original mass (without any solute) and the final mass, the scientists could find the added amount of solute, and from that, the number of moles of solute added. This means the correct answer choice is, "By weighing the beakers first, the scientists could find the added mass by subtracting the initial mass."
Example Question #761 : Act Science
Two scientists wanted to test the solubility of different substances. Solubility is a measure of how many moles of a given substance (known as the solute) can dissolve in a given volume of another substance (known as the solvent). The solvent can also be thought of as the substance present in greater amount, while the solute can be seen as the substance present in lesser amount. The scientists performed the following experiments to investigate this property.
Experiment 1
The scientists tested the number of moles of several substances that could be completely dissolved in
Table 1
Experiment 2
In this experiment, the scientists wanted to test the solubility of
Table 2
Suppose the scientists conducted a third experiment in which they dissolved 


This question requires some careful reading and extrapolation. We want to find the number of grams dissolved in
In experiment two, we need two details to guide us.
1) 
2) The highest temperature tested for methanol was 

So, the scientists had 


So, we can eliminate any answers lower than or equal to 


All ACT Science Resources

