ACT Science : Chemistry
Study concepts, example questions & explanations for ACT Science


All ACT Science Resources
Example Questions
Example Question #11 : How To Find Data Representation In Chemistry
The Ideal Gas Law is as follows:


A class of students began studying the Ideal Gas Law and how the Pressure and the Volume relate to one another. They took 20 moles of a sample gas and kept the room at a temperature of 300 Kelvin. They then used different sized containers of the gas to limit and expand the volume. At each different volume, they measure the pressure of the gas on its container. The table they made from their results is seen in table 1.
|
Temperature in Kelvin |
Pressure Measured in Pascals |
|
|
|
|
200 Kelvin |
16, 628 Pascals |
|
400 Kelvin |
33, 256 Pascals |
|
600 Kelvin |
49, 884 Pascals |
|
800 Kelvin |
66, 512 Pascals |
TABLE 1
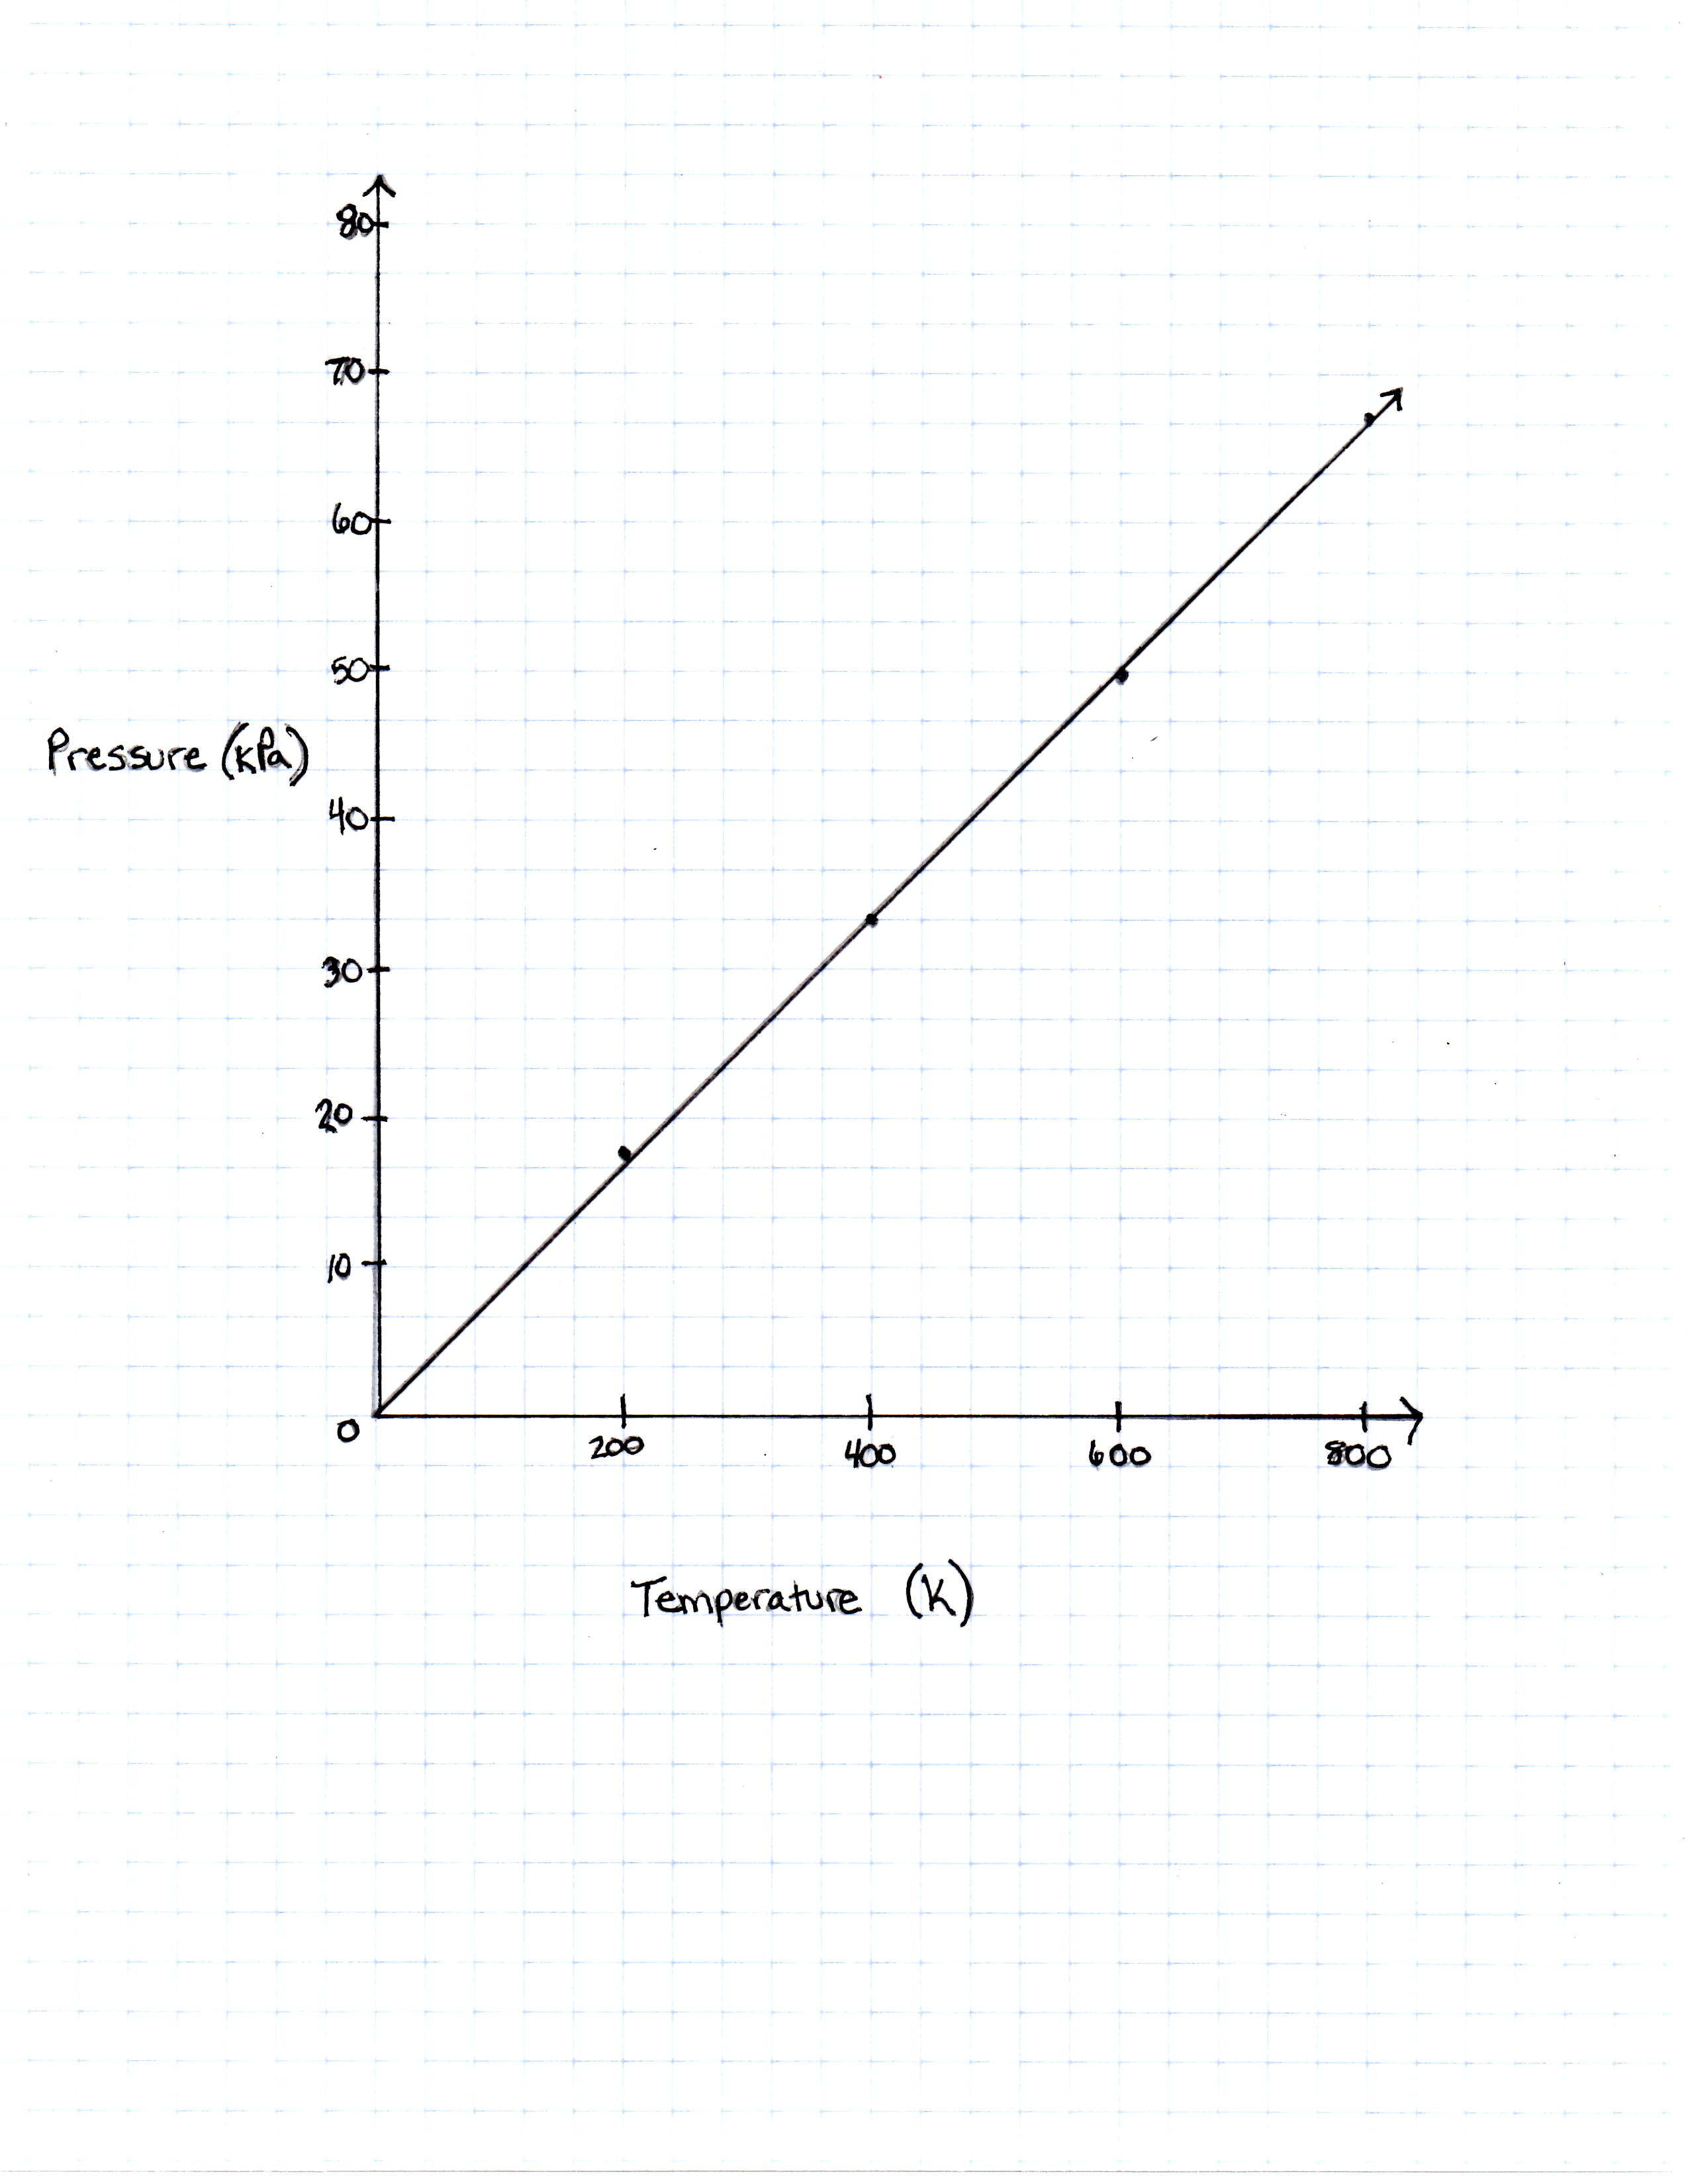
FIGURE 1
The graph the students made based on the data is seen in Figure 1.
Pressure is created by the movement of the gas molecules pushing against a container. 0 Kelvin is known as absolute 0, the temperature at which all molecule movement theoretically stops.
Describe the relationship between the temperature and the pressure.
They are directly related. As temperature increases, so does pressure.
They are inversely related. As temperature decreases, pressure increases.
The relationship cannot be determined from the graph.
They are unrelated.
The pressure remains the same no matter the temperature.
They are directly related. As temperature increases, so does pressure.
For every increase in temperature, there is a definite increase in pressure that can be found in the Ideal Gas Law equation. When the equation is solved for pressure
(20)}{2}(T)")
it can be thought of as the slope-intercept form of a line, with the y-intercept as 0 and the (20)}{2}")

Example Question #12 : Chemistry
The Millikin oil drop experiment is among the most important experiments in the history of science. It was used to determine one of the fundamental constants of the universe, the charge on the electron. For his work, Robert Millikin won the Nobel Prize in Physics in 1923.
Millikin used an experimental setup as follows in Figure 1. He opened a chamber of oil into an adjacent uniform electric field. The oil droplets sank into the electric field once the trap door opened, but were then immediately suspended by the forces of electricity present in the field.
Figure 1:
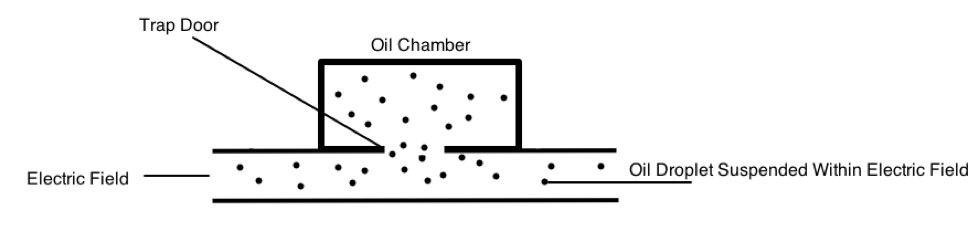
By determining how much force was needed to exactly counteract the gravity pulling the oil droplet down, Millikin was able to determine the force of electricity. This is depicted in Figure 2.
Using this information, he was able to calculate the exact charge on an electron. By changing some conditions, such as creating a vacuum in the apparatus, the experiment can be modified.
Figure 2:
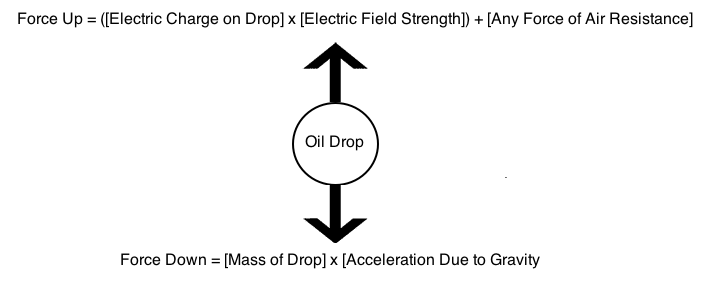
When the drop is suspended perfectly, the total forces up equal the total forces down. Because Millikin knew the electric field in the apparatus, the force of air resistance, the mass of the drop, and the acceleration due to gravity, he was able to solve the following equation:

 + [Air\hspace{1mm}Resistance] = [Mass] x [Acceleration\hspace{1mm}from\hspace{1mm}Gravity]")
 - [Air Resistance]}{Electric\hspace{1mm}Field}")
Table 1 summarizes the electric charge found on oil drops in suspension. Millikin correctly concluded that the calculated charges must all be multiples of the fundamental charge of the electron. A hypothetical oil drop contains some net charge due to lost electrons, and this net charge cannot be smaller than the charge on a single electron.
Table 1:
|
Trial # |
Electric Charge Calculated in Coulombs (C) |
Vacuum Used? |
|
1 |
1.602176487 x 10⁻⁸ |
No |
|
2 |
1.602176487 x 10⁻² |
Yes |
|
3 |
1.602176487 x 10⁻⁶ |
No |
|
4 |
1.602176487 x 10⁻⁴ |
Yes |
Based on Figure 2, an increase on the mass of an oil drop being studied would ______ the acceleration due to gravity?
Initially decrease, then increase
Decrease
Not change
Initially increase, then decrease
Increase
Not change
The acceleration due to gravity and the mass are two distinct variables in the equation presented in Figure 2. Increasing the mass would increase the overall force in the downward direction, but would not increase the acceleration due to gravity.
Example Question #12 : Chemistry
Current high levels of fossil fuel use, including coal-burning power plants and gasoline-powered automobiles, have helped contribute to the high concentrations of sulfur trioxide, SO3, found in the atmosphere. When sulfur trioxide and water interact, they can undergo the following chemical reaction to produce sulfuric acid, which is the main contributor to acid rain worldwide:

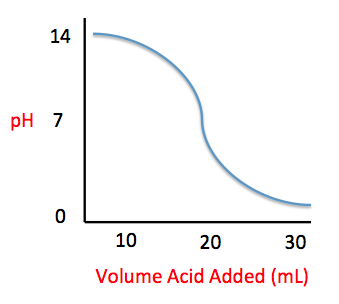
Acid rain showers are particularly common near coal-burning power plants and large cities. These showers are responsible for significant economic damage to sidewalks, roads, and buildings. Scientists interested in studying the effects of acid rain often use basic substances like calcium carbonate, the main component of limestone buildings, and expose them to varying volumes of acid rain to determine what volume of acid rain is necessary to begin to erode a building. A sample graph of one scientist’s experiment is replicated below:
Measuring acid and base levels is commonly done with a scale called pH, which uses the concentration of hydrogen ions to determine the acidity. Hydrogen ions are in a balance with hydroxide ions to give a scale with a range from 0 to 14. Values equal to or between 0 and 6.9 represent the acidic range where hydrogen ions predominate and values equal to or ranging from 7.1 and 14 represent the basic range where hydroxide ions predominate. Thus, the more hydrogen ions present, the more acidic the solution.
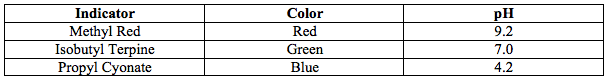
Scientists can tell when a titration (pH) experiment passes a certain pH using compounds called indicators. Indicators are usually colorless at pH levels below that of their specified color change. A table of indicators used by the above scientists and the pH at which they change colors is presented below.
What is the pH of a solution containing calcium carbonate and sulfuric acid when 20 mL of sulfuric acid have been added?
10
12
2
7
7
This question asks us to use the provided figure to determine the average pH of a solution in the titration explained in the passage. We can see that when 20 mL of sulfuric acid have been added to the calcium carbonate solution, the resulting pH falls in the middle of the sigmoidal curve at a pH of around 7. These problems are important to understand because the ACT tends to test the interpretation of figures and charts heavily.
Example Question #13 : Chemistry
Current high levels of fossil fuel use, including coal-burning power plants and gasoline-powered automobiles, have helped contribute to the high concentrations of sulfur trioxide, SO3, found in the atmosphere. When sulfur trioxide and water interact, they can undergo the following chemical reaction to produce sulfuric acid, which is the main contributor to acid rain worldwide:
Acid rain showers are particularly common near coal-burning power plants and large cities. These showers are responsible for significant economic damage to sidewalks, roads, and buildings. Scientists interested in studying the effects of acid rain often use basic substances like calcium carbonate, the main component of limestone buildings, and expose them to varying volumes of acid rain to determine what volume of acid rain is necessary to begin to erode a building. A sample graph of one scientist’s experiment is replicated below:
Measuring acid and base levels is commonly done with a scale called pH, which uses the concentration of hydrogen ions to determine the acidity. Hydrogen ions are in a balance with hydroxide ions to give a scale with a range from 0 to 14. Values equal to or between 0 and 6.9 represent the acidic range where hydrogen ions predominate and values equal to or ranging from 7.1 and 14 represent the basic range where hydroxide ions predominate. Thus, the more hydrogen ions present, the more acidic the solution.
Scientists can tell when a titration (pH) experiment passes a certain pH using compounds called indicators. Indicators are usually colorless at pH levels below that of their specified color change. A table of indicators used by the above scientists and the pH at which they change colors is presented below.
What is the pH of a solution containing calcium carbonate and sulfuric acid when 29 mL of sulfuric acid have been added?
0
3
7
12
0
In this question, we are asked to determine the relationship between pH and volume of sulfuric acid added to the basic solution. This is best done by using the graph provided in the passage. We can see that, as we add more sulfuric acid, the pH of the solution decreases. Around an addition of 30 mL, we can see that the pH of the solution is beginning to approach 0. Given the range of answer choices provided, we can estimate that addition of 29 mL would give a pH of around 0.
Example Question #11 : How To Find Data Representation In Chemistry
Current high levels of fossil fuel use, including coal-burning power plants and gasoline-powered automobiles, have helped contribute to the high concentrations of sulfur trioxide, SO3, found in the atmosphere. When sulfur trioxide and water interact, they can undergo the following chemical reaction to produce sulfuric acid, which is the main contributor to acid rain worldwide:
Acid rain showers are particularly common near coal-burning power plants and large cities. These showers are responsible for significant economic damage to sidewalks, roads, and buildings. Scientists interested in studying the effects of acid rain often use basic substances like calcium carbonate, the main component of limestone buildings, and expose them to varying volumes of acid rain to determine what volume of acid rain is necessary to begin to erode a building. A sample graph of one scientist’s experiment is replicated below:
Measuring acid and base levels is commonly done with a scale called pH, which uses the concentration of hydrogen ions to determine the acidity. Hydrogen ions are in a balance with hydroxide ions to give a scale with a range from 0 to 14. Values equal to or between 0 and 6.9 represent the acidic range where hydrogen ions predominate and values equal to or ranging from 7.1 and 14 represent the basic range where hydroxide ions predominate. Thus, the more hydrogen ions present, the more acidic the solution.
Scientists can tell when a titration (pH) experiment passes a certain pH using compounds called indicators. Indicators are usually colorless at pH levels below that of their specified color change. A table of indicators used by the above scientists and the pH at which they change colors is presented below.
The relationship between pH and volume of acid added can best be described as which of the following?
Inversely Proportional
Directly Proportional
Sigmoidal (S-shaped)
Indirectly Proportional
Sigmoidal (S-shaped)
In general, the ACT asks students to identify four different types of graphs - directly proportional, inversely proportional, indirectly proportional, and sigmoidal. As the name implies sigmoidal graphs have an "S" shape. Directly proportional graphs are presented as a positive-slope straight line, while the opposite is true for inversely proportional. Indirectly proportional graphs do not present the relationship between two variables as a straight line. Instead the line may be exponential or logarithmic.
Example Question #15 : Chemistry
Current high levels of fossil fuel use, including coal-burning power plants and gasoline-powered automobiles, have helped contribute to the high concentrations of sulfur trioxide, SO3, found in the atmosphere. When sulfur trioxide and water interact, they can undergo the following chemical reaction to produce sulfuric acid, which is the main contributor to acid rain worldwide:
Acid rain showers are particularly common near coal-burning power plants and large cities. These showers are responsible for significant economic damage to sidewalks, roads, and buildings. Scientists interested in studying the effects of acid rain often use basic substances like calcium carbonate, the main component of limestone buildings, and expose them to varying volumes of acid rain to determine what volume of acid rain is necessary to begin to erode a building. A sample graph of one scientist’s experiment is replicated below:
Measuring acid and base levels is commonly done with a scale called pH, which uses the concentration of hydrogen ions to determine the acidity. Hydrogen ions are in a balance with hydroxide ions to give a scale with a range from 0 to 14. Values equal to or between 0 and 6.9 represent the acidic range where hydrogen ions predominate and values equal to or ranging from 7.1 and 14 represent the basic range where hydroxide ions predominate. Thus, the more hydrogen ions present, the more acidic the solution.
Scientists can tell when a titration (pH) experiment passes a certain pH using compounds called indicators. Indicators are usually colorless at pH levels below that of their specified color change. A table of indicators used by the above scientists and the pH at which they change colors is presented below.
Solutions A, B, and C each contain a different number of hydrogen ions. Solution A has a pH of 6.9, solution B has a pH of 7.3, and solution C has a pH of 1.3. Place the solutions in order of increasing number of hydrogen ions.
B < A < C
B < C < A
A < B < C
C < A < B
B < A < C
The passage describes that pH indicates the relative number of hydrogen ions present in a solution. We know that more ions are present when the pH is the lowest. Thus, using the pH values provided in the question along with the information contained in the passage, we can place the solutions in decending order with respect to their pH, which is equivalent to listing them in increasing hydrogen number.
Example Question #11 : Chemistry
During digestion, the energy in food is converted to energy the body can use. Scientists use calorimetry experiments to measure the calories, or energy, provided by food when it is digested or burned.
The relationship used to find the heat transferred energy ")


In this experiment, food was burned over a Bunsen burner under a can of 200 ml of water. The temperature change of the water and mass change of the food can be used to determine the calories in four different food items.
Table 1 shows the values of the change of mass of the food items, the change in temperature of the water and the energy. Table 2 shows the energy to mass ratio of three of those food items.
Table 1
Roasted Peanut Peanut Cracker Cheese Puff
Water Temp. Initial 23.9 °C 33.2 °C 40.3 °C 53.9 °C
Water Temp. Final 30.0 °C 40.9 °C 55.9 °C 62.8 °C
Food Mass Initial 0.69 g 0.61 g 3.21 g 1.22 g
Food Mass Final 0.38 g 0.21 g 0.91 g 0.48 g
Energy 1.22 Cal 1.54 Cal 3.12 Cal 1.78 Cal
Table 2
Sample Energy to Mass Ratio (Cal/g)
1 1.36
2 3.93
3 2.40
According to information from Tables 1 and 2, order the samples' energy to mass ratios from least to greatest.
Roasted Peanut, Cracker, Cheese Puff, Peanut
Cracker, Roasted Peanut, Cheese Puff, Peanut
Peanut, Roasted Peanut, Cheese Puff, Cracker
Roasted Peanut, Peanut, Cracker, Cheese Puff
Roasted Peanut, Cracker, Cheese Puff, Peanut
The order of "Roasted Peanut, Cracker, Cheese Puff, Peanut" is correct and can be found after estimating the energy of the food sample divided by the difference between the initial and final masses of the samples.
Example Question #12 : Chemistry
During digestion, the energy in food is converted to energy the body can use. Scientists use calorimetry experiments to measure the calories, or energy, provided by food when it is digested or burned.
The relationship used to find the heat transferred energy ")
In this experiment, food was burned over a Bunsen burner under a can of 200 ml of water. The temperature change of the water and mass change of the food can be used to determine the calories in four different food items.
Table 1 shows the values of the change of mass of the food items, the change in temperature of the water and the energy. Table 2 shows the energy to mass ratio of three of those food items.
Table 1
Roasted Peanut Peanut Cracker Cheese Puff
Water Temp. Initial 23.9 °C 33.2 °C 40.3 °C 53.9 °C
Water Temp. Final 30.0 °C 40.9 °C 55.9 °C 62.8 °C
Food Mass Initial 0.69 g 0.61 g 3.21 g 1.22 g
Food Mass Final 0.38 g 0.21 g 0.91 g 0.48 g
Energy 1.22 Cal 1.54 Cal 3.12 Cal 1.78 Cal
Table 2
Sample Energy to Mass Ratio (Cal/g)
1 1.36
2 3.93
3 2.40
The student performing the experiment concluded that eating an amount of crackers would provide an athlete with more energy than eating the same amount of any of the other food samples. Do the results in Tables 1 and 2 support this claim?
Yes; crackers have a higher energy to mass ratio than any other food samples.
No; crackers produce a lower energy than other samples.
No; crackers have a lower energy to mass ratio than another food sample.
Yes; crackers produce the most energy.
No; crackers have a lower energy to mass ratio than another food sample.
"No; crackers have a lower energy to mass ratio than another food sample" is correct because the question asks for the energy given from a consistent amount of each food sample. Therefore, the energy to mass ratio is what should be used to compare the food samples, not the energy given in the table.
Example Question #13 : Chemistry
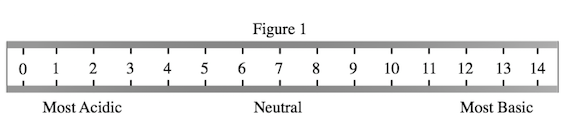
A student wished to study the acidity and basicity of various household ingredients and chemicals using her own, homemade pH indicator. A pH indicator is a substance that changes colors to indicate the acidity or basicity of a chemical solution. Acids can be defined as substances that donate hydrogen ions, or H+, while bases are substances that accept H+ ions. The strength of these acids and bases can be measured using the pH scale as shown in Figure 1.
Experiment 1:
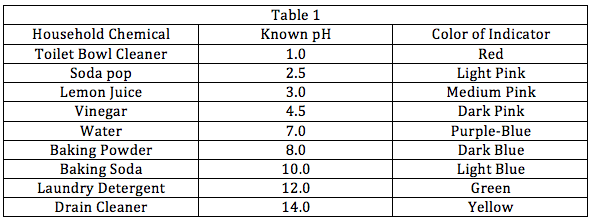
The student placed a leaf of red cabbage in a blender with one liter of water and blended until the cabbage had been liquefied. She then strained the purple mixture and bottled it. The student then added one drop of her homemade cabbage pH indicator to a variety of household chemicals listed in Table 1. She recorded the known pH of these chemicals as well as the color the indicator turned when added to these chemicals.
Experiment 2:
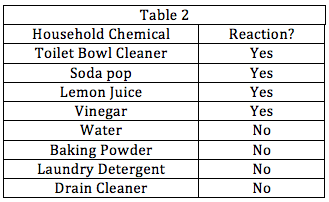
The student wanted to see how baking soda would react in the presence of other household chemicals. She combined baking soda in water separately with each of the other chemicals used in Experiment 1. Some combinations would create bubbling while some other combinations wouldn't. She recorded the results in Table 2 below.
If four solutions were made from household chemicals and the red cabbage indicator and resulted in the four following colors, which solution contained the most acidic chemical?
Green
Light Pink
Dark Pink
Yellow
Light Pink
Figure 1 shows that the lowest pH values correlate with highest acidity. Consult Table 1 to see the corresponding pH values for the four indicator colors mentioned in the question. Light pink, which indicates a pH of roughly 2.5, is the color of the most acidic solution, as 2.5 is the lowest number correlated with a color mentioned in the question.
Example Question #14 : Chemistry
A student wished to study the acidity and basicity of various household ingredients and chemicals using her own, homemade pH indicator. A pH indicator is a substance that changes colors to indicate the acidity or basicity of a chemical solution. Acids can be defined as substances that donate hydrogen ions, or H+, while bases are substances that accept H+ ions. The strength of these acids and bases can be measured using the pH scale as shown in Figure 1.
Experiment 1:
The student placed a leaf of red cabbage in a blender with one liter of water and blended until the cabbage had been liquefied. She then strained the purple mixture and bottled it. The student then added one drop of her homemade cabbage pH indicator to a variety of household chemicals listed in Table 1. She recorded the known pH of these chemicals as well as the color the indicator turned when added to these chemicals.
Experiment 2:
The student wanted to see how baking soda would react in the presence of other household chemicals. She combined baking soda in water separately with each of the other chemicals used in Experiment 1. Some combinations would create bubbling while some other combinations wouldn't. She recorded the results in Table 2 below.
Which of the following answer choices lists the four acids lemon juice, vinegar, toilet bowl cleaner, and soda pop in order from weakest to strongest?
Vinegar, Lemon Juice, Soda Pop, Toilet Bowl Cleaner
Toilet Bowl Cleaner, Vinegar, Soda Pop, Lemon Juice
Vinegar, Soda Pop, Lemon Juice, Toilet Bowl Cleaner
Toilet Bowl Cleaner, Soda Pop, Lemon Juice, Vinegar
Vinegar, Lemon Juice, Soda Pop, Toilet Bowl Cleaner
Figure 1 shows that the strongest acids have the lowest pH values. So, we need to list these acids from the highest pH to the lowest pH. Note that Table 1 lists the chemicals in order of increasing pH. That means the correct order of increasing acidity will list the acids in order from the bottom up on Table 1, with vinegar first, as it is the weakest acid, and toilet bowl cleaner last, as it is the strongest acid.


All ACT Science Resources

