ACT Science : Chemistry
Study concepts, example questions & explanations for ACT Science


All ACT Science Resources
Example Questions
Example Question #21 : Chemistry
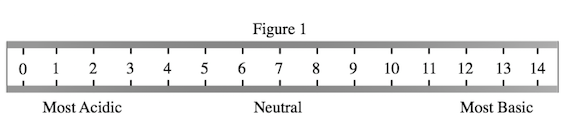
A student wished to study the acidity and basicity of various household ingredients and chemicals using her own, homemade pH indicator. A pH indicator is a substance that changes colors to indicate the acidity or basicity of a chemical solution. Acids can be defined as substances that donate hydrogen ions, or H+, while bases are substances that accept H+ ions. The strength of these acids and bases can be measured using the pH scale as shown in Figure 1.
Experiment 1:
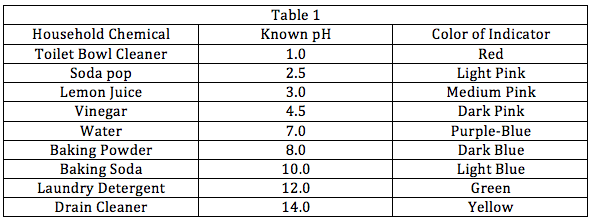
The student placed a leaf of red cabbage in a blender with one liter of water and blended until the cabbage had been liquefied. She then strained the purple mixture and bottled it. The student then added one drop of her homemade cabbage pH indicator to a variety of household chemicals listed in Table 1. She recorded the known pH of these chemicals as well as the color the indicator turned when added to these chemicals.
Experiment 2:
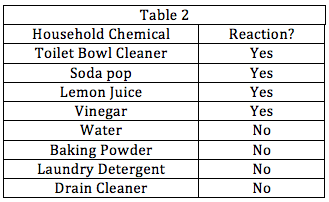
The student wanted to see how baking soda would react in the presence of other household chemicals. She combined baking soda in water separately with each of the other chemicals used in Experiment 1. Some combinations would create bubbling while some other combinations wouldn't. She recorded the results in Table 2 below.
The student will attempt to color in Figure 1 with the appropriate color the indicator will turn at various pHs. Which answer choice lists the colors in the correct order, from left, or low pHs, to right, or high pHs?
Pink, Red, Yellow, Green, Blue, Purple
Red, Pink, Purple, Blue, Green, Yellow
Yellow, Green, Blue, Purple, Pink, Red
Purple, Blue, Green, Yellow, Red, Pink
Red, Pink, Purple, Blue, Green, Yellow
Note that Table 1 lists the chemicals from lowest to highest pH. Thus, we must simply list the colors that correspond with these increasing pH values in the order down the list on Table 1, starting with red, and ending with yellow.
Example Question #22 : Chemistry
Phase diagrams show what state of matter (solid, liquid, or gas) a chemical compound is in for a given temperature and pressure. Compounds 


The triple point is the temperature and pressure at which a compound exists simultaneously in all three states of matter and is found on the phase diagram where the three curves intersect.

At 


Solid
All three states of matter at once
Liquid
Gas
Solid
On the graph for Compound 

Example Question #23 : Chemistry
Phase diagrams show what state of matter (solid, liquid, or gas) a chemical compound is in for a given temperature and pressure. Compounds
The triple point is the temperature and pressure at which a compound exists simultaneously in all three states of matter and is found on the phase diagram where the three curves intersect.
Which answer choice ranks the Compounds A-C in order of increasing triple point temperatures?


The triple point, as stated in the introduction, is found where all three curves intersect. The triple point temperature is the temperature at which this point occurs. The triple point temperatures for Compounds 


Example Question #21 : How To Find Data Representation In Chemistry
Phase diagrams show what state of matter (solid, liquid, or gas) a chemical compound is in for a given temperature and pressure. Compounds
The triple point is the temperature and pressure at which a compound exists simultaneously in all three states of matter and is found on the phase diagram where the three curves intersect.
What processes must occur at temperatures and pressures along the green curve in these figures?
Boiling and condensing
Melting and freezing
Condensing and melting
Freezing and boiling
Boiling and condensing
The green line represents the equilibrium between liquid and gas. When liquids change to gases, the process is called boiling. When gases change to liquids, the process is called condensing. Thus, the line represents both boiling and condensing.
Example Question #25 : Chemistry
Phase diagrams show what state of matter (solid, liquid, or gas) a chemical compound is in for a given temperature and pressure. Compounds
The triple point is the temperature and pressure at which a compound exists simultaneously in all three states of matter and is found on the phase diagram where the three curves intersect.
The process of a gas being converted to a solid is called "deposition." For what range of temperatures in degrees Kelvin (


As shown below, sketch a line from 


Example Question #26 : Chemistry
Phase diagrams show what state of matter (solid, liquid, or gas) a chemical compound is in for a given temperature and pressure. Compounds
The triple point is the temperature and pressure at which a compound exists simultaneously in all three states of matter and is found on the phase diagram where the three curves intersect.
The slope of the blue line depends on the relative densities of the solid and the liquid. A positive slope means that the solid is denser than the liquid; a negative slope means the opposite. Which compounds have solid phases that are denser than their liquid phases?
Compounds B and C
Compound B only
Compound A only
Compounds A and C
Compounds B and C
Compound B and C both have blue lines with positive slopes; this means that their solid phase is denser than their liquid phase.
Example Question #27 : Chemistry
Phase diagrams show what state of matter (solid, liquid, or gas) a chemical compound is in for a given temperature and pressure. Compounds
The triple point is the temperature and pressure at which a compound exists simultaneously in all three states of matter and is found on the phase diagram where the three curves intersect.
In a room with a pressure of 10 atmospheres (atm) at 

Solid, then gas
Solid, then gas, then liquid
Solid, then liquid
Solid, then liquid, then gas
Solid, then liquid
Draw a line straight from 10 atm over to where this line will intersect with the temperature value of 

Example Question #28 : Chemistry
An experiment was carried out measuring the boiling point and freezing point of an unknown organic liquid (Sample X) with varying levels of salt dissolved within it. The experiment was conducted in the following manner:
First, the experimenter measured the boiling point and freezing point of Sample X.
Next, a known quantity of salt was dissolved into the sample and then the boiling point and freezing points were measured again.
The results of the experiment are outlined in the table below:

What would we predict the melting point of Sample X to be if the concentration of salt in it were 50 mg/L?


More information is necessary.


If we look at the chart, we see that every time the concentration of the salt is increased by 10 mg/L, the melting point temperature decreases by 


Example Question #29 : Chemistry
An experiment was carried out measuring the boiling point and freezing point of an unknown organic liquid (Sample X) with varying levels of salt dissolved within it. The experiment was conducted in the following manner:
First, the experimenter measured the boiling point and freezing point of Sample X.
Next, a known quantity of salt was dissolved into the sample and then the boiling point and freezing points were measured again.
The results of the experiment are outlined in the table below:
What is the normal freezing point of Sample X?


This question is straightforward. The trick is to interpret correctly what the question means by "normal freezing point." We can presume that this means the freezing point of Sample X without any salt added, as this would mean that Sample X is in its normal state. Therefore, the answer is simply 
Example Question #30 : Chemistry
An experiment was carried out measuring the boiling point and freezing point of an unknown organic liquid (Sample X) with varying levels of salt dissolved within it. The experiment was conducted in the following manner:
First, the experimenter measured the boiling point and freezing point of Sample X.
Next, a known quantity of salt was dissolved into the sample and then the boiling point and freezing points were measured again.
The results of the experiment are outlined in the table below:
What would we predict the boiling point of Sample X to be if the concentration of salt within it were 210 mg/L?


More information is necessary to do this calculation.

This question may be intimidating because at face value, it appears to require some sort of equation; however, if we look at the trend in the chart provided, it comes down to interpreting the apparent relationship and extrapolating.
As we can see in the chart, every time the concentration of salt increases by 10 mg/L, the boiling point increases by 1.4 degrees Celsius. This relationship remains consistent at all the given temperatures, so we can reasonably extrapolate. Therefore, if the concentration increases by 100 mg/L, the boiling point increases by =14^{\circ}C")
 + 1.4")


All ACT Science Resources

