ACT Science : Chemistry
Study concepts, example questions & explanations for ACT Science


All ACT Science Resources
Example Questions
Example Question #31 : Chemistry
In studying the effects of adding heat to different substances on each substance's temperature, a researcher conducted the following experiment. The researcher added 1,000 Joules of energy by a controlled heat lamp to four different substances. The temperature change in each substance that was caused by the heat was then measured and recorded. The results of this experiment are shown below.

The researcher is aware of a concept called specific heat and knows that lead has a lower specific heat than wood, which has a lower specific heat than cardboard, which has a lower specific heat than styrofoam. Therefore, the researcher has ordered the objects in the table from lowest specific heat (lead) to highest (styrofoam).
A new substance, Substance X, is discovered with a specific heat greater than that of cardboard but less than that of styrofoam. What would we expect would happen if we were to add 1,000 Joules of energy to a sample of Substance X assuming the exact same conditions as in the experiment above?
Its temperature will increase by around 5 degrees Celsius
Its temperature will increase by around 0.1 degrees Celsius
Its temperature will increase by around 3 degrees Celsius
Its temperature will not change.
More information is necessary to make this prediction.
Its temperature will increase by around 3 degrees Celsius
The correct answer 3 degrees Celsius because it is the one that falls between the temperature changes observed for cardboard and styrofoam. This is a classic case of extrapolating from data trends and making predictions. Since we know the specific heat is between those of cardboard and styrofoam, we can also assume that the temperature change would be between those two substances' temperature changes as well.
Example Question #31 : How To Find Data Representation In Chemistry

The rate of a reaction is defined as the rate at which the products of a reaction are produced. A researcher wants to investigate the rate of reaction of the combustion of theoretical compound 

The results of the experiment are shown in the table below. The brackets ([]) indicate concentration measured in mol/L.

According to the data in the table, what is the apparent relationship between the starting concentration of the theoretical compound and the rate of the reaction?
Negative and non-linear
Positive and non-linear
There is no discernible relationship.
Negative and linear
Positive and linear
Positive and non-linear
This question is a little bit tricky because we first need to sort through what is going on between trials 1 and 2. When the researcher doubles the oxygen concentration for trial 2, the rate appears to double exactly. Then, when the oxygen concentration is held steady between trials 2 and 3, doubling the concentration of the theoretical compound results in a rate that is more than double of the rate in trial 2. This should indicate to us that the relationship is not just positive, it is non-linear. Although the question does not ask, the relationship is exponential.
Example Question #33 : Chemistry
The rate of a reaction is defined as the rate at which the products of a reaction are produced. A researcher wants to investigate the rate of reaction of the combustion of theoretical compound
The results of the experiment are shown in the table below. The brackets ([]) indicate concentration measured in mol/L.
According to the data, what is the apparent relationship between oxygen concentration and the rate of the reaction?
There is no discernible relationship.
Positive and linear
Negative and linear
Negative and non-linear
Positive and non-linear
Positive and linear
The correct answer is a positive, linear relationship. Although more data would be helpful in order to make this claim with certainty, it would appear that between trials 1 and 2, doubling the oxygen concentration exactly doubled the rate of reaction. This is a positive linear correlation.
Example Question #31 : Chemistry
Gases can be described by their average molecular speeds. Gases are made up of huge numbers of molecules which vary greatly in speed. The average speeds of those molecules is related to the mass of the gas particles. For example, a heavy gas will have a much lower average molecular speed than a lighter gas.
The rate of effusion of a gas is defined as the rate at which a gas in a chamber can escape through a pinhole. A gas molecule with a higher average molecular speed is more likely to exit a pinhole and therefore has a higher rate of effusion.

The above diagram is a graph of the different speeds of the molecules of Gas Z and their different frequencies. Higher on the y-axis implies higher frequency while lower implies lower frequency. Which point most likely represents the average speed of Gas Z?
Point C
Point B
Point A
Point B
Point D
Point C
The correct answer is point C. The average is most likely to be closest to the most frequent speed which in this graph is point C.
Example Question #31 : Chemistry
Gases can be described by their average molecular speeds. Gases are made up of huge numbers of molecules which vary greatly in speed. The average speeds of those molecules is related to the mass of the gas particles. For example, a heavy gas will have a much lower average molecular speed than a lighter gas.
The rate of effusion of a gas is defined as the rate at which a gas in a chamber can escape through a pinhole. A gas molecule with a higher average molecular speed is more likely to exit a pinhole and therefore has a higher rate of effusion.

The above graph displays the speeds of the molecules of two gases (Gas A and Gas B) and their relative frequencies. Higher on the y-axis corresponds with higher frequency. If we know that Gas A or Gas B could either be hydrogen gas (weight = 1amu) or carbon dioxide (weight = 44amu) what could the identities of the gases be?
More information is necessary.
Gas A is hydrogen and Gas B is carbon dioxide.
Gas A and Gas B are both carbon dioxide.
Gas A and Gas B are both hydrogen.
Gas B is hydrogen, and Gas A is carbon dioxide.
Gas B is hydrogen, and Gas A is carbon dioxide.
The correct answer is that Gas B is hydrogen and Gas A is carbon dioxide. Since carbon dioxide is heavier, we would expect its average speed to be lower than that of hydrogen. If we take the peak of these curves to correspond roughly to the average speed, Gas B shows a higher average speed and is therefore most likely hydrogen.
Example Question #31 : How To Find Data Representation In Chemistry
During digestion, the energy in food is converted to energy the body can use. Scientists use calorimetry experiments to measure the calories, or energy, provided by food when it is digested or burned.
The relationship used to find the heat transferred energy ")


In this experiment, food was burned over a Bunsen burner under a can of 200 ml of water. The temperature change of the water and mass change of the food can be used to determine the calories in four different food items.
Table 1 shows the values of the change of mass of the food items, the change in temperature of the water and the energy. Table 2 shows the energy to mass ratio of three of those food items.
Table 1
Roasted Peanut Peanut Cracker Cheese Puff
Water Temp. Initial 23.9 °C 33.2 °C 40.3 °C 53.9 °C
Water Temp. Final 30.0 °C 40.9 °C 55.9 °C 62.8 °C
Food Mass Initial 0.69 g 0.61 g 3.21 g 1.22 g
Food Mass Final 0.38 g 0.21 g 0.91 g 0.48 g
Energy 1.22 Cal 1.54 Cal 3.12 Cal 1.78 Cal
Table 2
Sample Energy to Mass Ratio (Cal/g)
1 1.36
2 3.93
3 2.40
Based on the information in Tables 1 and 2, Sample 2 is most likely which of the following food items?
Peanut
Cracker
Cheese puff
Roasted peanut
Roasted peanut
The roasted peanut is the correct answer. This can be estimated by finding change in mass of the items and dividing the energy by these results.
Example Question #32 : Chemistry
Nanoparticles are fabricated by vigorously mixing the constituent components of the particle in solution. A scientist has four different compositions that she has tested: Composition A, Composition B, Composition C, and Composition D. All of these compositions were observed under similar laboratory conditions using different mixing times. The average particle size for each scenario was recorded in the provided table.
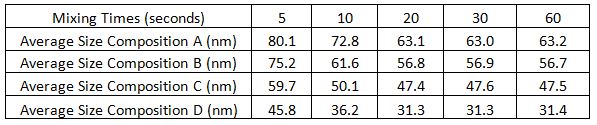
A component used in nanoparticle synthesis is polyethylene glycol, or PEG. It is known that larger concentrations of PEG create nanoparticles with smaller radii. Based on this information, which composition is most likely to contain the largest amount of PEG?
Composition D
Composition A
Composition B
Composition C
It cannot be determined from the information that is given
Composition D
It is not important to know what PEG is exactly; it is important to know that an increase in PEG will cause nanoparticles' radii to decrease in size. Looking at specific mixing times, it can be seen that Composition D always has nanoparticles with smaller radii than the other compositions. Therefore, it can be concluded that Composition D contains the largest amount of PEG.
Example Question #36 : Chemistry
Nanoparticles are fabricated by vigorously mixing the constituent components of the particle in solution. A scientist has four different compositions that she has tested: Composition A, Composition B, Composition C, and Composition D. All of these compositions were observed under similar laboratory conditions using different mixing times. The average particle size for each scenario was recorded in the provided table.
If the scientist requires nanoparticles larger than 
Composition A and Composition B
Composition B and Composition D
Composition B and Composition C
Composition A and Composition C
Composition A and Composition D
Composition A and Composition B
The scientist requires nanoparticles that have a radius greater than 


Example Question #37 : Chemistry
Nanoparticles are fabricated by vigorously mixing the constituent components of the particle in solution. A scientist has four different compositions that she has tested: Composition A, Composition B, Composition C, and Composition D. All of these compositions were observed under similar laboratory conditions using different mixing times. The average particle size for each scenario was recorded in the provided table.
The scientist wants to make the nanoparticles that are all the same size. If the minimum mixing time required to make nanoparticles is 
Mix all of the compositions for

Mix Composition A for 

It cannot be determined from the given information
Increase the mixing times for Composition A, B, and C past 

It cannot be achieved
It cannot be achieved
A method to solve this question is the process of elimination. Increasing the mixing time after 


Example Question #32 : Chemistry
The Environmental Protection Agency compiled the following information about heavy metals in drinking water. Heavy metals are toxic, and thus must be monitored very closely. All amounts are given in parts per billion (ppb), a common measurement of concentration for trace contaminants. Figure 1 shows total heavy metal contamination in each city as a makeup of various percentages of specific contaminants. Figure 2 shows specific amounts of contaminants (with the same color coding) in ppb as well as total contamination level in ppb.

Figure 1

Figure 2
For each total amount of contamination in each city, which has the highest percent cadmium?
Chicago
Miami
Seattle
Boston
Chicago
Remember that pie charts show percentages of a total best. Figure 1's pie charts shows that cadmium, shown in yellow, is present in the highest percentage of any total in Chicago.


All ACT Science Resources

