SSAT Middle Level Math : Tables
Study concepts, example questions & explanations for SSAT Middle Level Math


All SSAT Middle Level Math Resources
Example Questions
Example Question #41 : Measurement & Data
Mrs. Smith’s class made a line plot to show the amount of sugar that each student consumes in a given day.
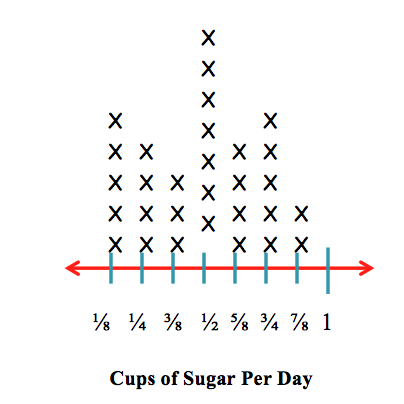
How many students consume 


Each X represents one person. There are 

Example Question #21 : Tables
Mrs. Smith’s class made a line plot to show the amount of sugar that each student has in a given day.
How many students have 


Each X represents one person. There are 

Example Question #4 : Make A Line Plot To Display A Data Set Of Measurements In Fractions And Solve Problems: Ccss.Math.Content.5.Md.B.2
Mrs. Smith’s class made a line plot to show the amount of sugar that each student has in a given day.
How many students have 


To solve this problem, we have to add the number of Xs above the 

There are 


Example Question #44 : Measurement & Data
Mrs. Smith’s class made a line plot to show the amount of sugar that each student has in a given day.
How many students have 


Each X represents one person. There are 

Example Question #45 : Measurement & Data
Mrs. Smith’s class made a line plot to show the amount of sugar that each student has in a given day.
How many students have 


Each X represents one person. There are 

Example Question #215 : Data Analysis And Probability
Find 
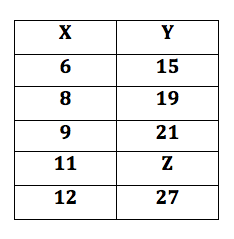


If you are faced with a chart and a missing number, you need to figure out the pattern in the pairs that are shown.
If you think you have discovered the pattern, make sure to test it on each known pair and test if it is true for every pair.
The pattern will always stay the same. For these set of numbers the formula is

Therefore,
+3=25")
Example Question #214 : Data Analysis And Probability
The table below gives the number of students who scored in each of five ranges on a standardized test.

No student scored below 51.
What percent of the students scored 71 or better (nearest whole number)?


More information is needed to answer the question.


Add the numbers of students whose scores fell in the 71-80, 81-90, and 91-100 ranges:

Now add the number of students who took the test.

To find what percent 161 is of 241, evaluate:

67% of the students scored 71 or better.
Example Question #41 : Measurement & Data
The line chart shows how many books each student in Mrs. Smith's class read this week. How many students are in Mrs. Smith's class?
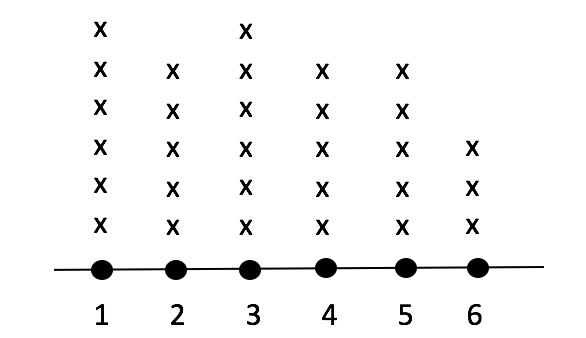


In order to determine how many students there are we need to count up all the x marks above each number in the line chart, as each x represents one student. We know that 6 students read one book, 5 read two books, 6 read three books, 5 read four books, 5 read five books, and 3 read six books. 5 + 6 + 5 + 6 + 5 + 3 = 30, so the correct answer is 30.

Certified Tutor

Certified Tutor

All SSAT Middle Level Math Resources

