SSAT Middle Level Math : Tables
Study concepts, example questions & explanations for SSAT Middle Level Math


All SSAT Middle Level Math Resources
Example Questions
Example Question #11 : Tables
The above circle graph shows the results of a school election. According to the rules, the office of President falls to the student who wins the most votes, and the office of Vice-President falls to the student who finishes second. A runoff only happens in case of a tie.
Which of the following is the result of this election?
Phelps and Wells will face each other in a runoff to determine which will be President and which will be Vice-President.
Phelps was elected President and Wells was elected Vice-President.
Phelps was elected President; Creighton and Wells will face each other in a runoff to determine who will be Vice-President.
Phelps and Creighton will face each other in a runoff to determine which will be President and which will be Vice-President.
Phelps was elected President and Creighton was elected Vice-President.
Phelps was elected President and Creighton was elected Vice-President.
The two largest portions of the pie graph are light blue (Phelps) and orange (Creighton); Phelps got the most votes and Creighton got the second-most. Therefore, Phelps was elected President and Creighton was elected Vice-President - there will be no runoffs.
Example Question #1 : Tables
The above circle graph shows the results of a school election. According to the rules, the office of President falls to the student who wins the most votes; the office of Vice-President falls to the student who finishes second; the office of Secretary-Treasurer falls to the student who finishes third. A runoff only happens in case of a tie.
Which candidate was elected Secretary-Treasurer?
Hawley was elected Secretary-Treasurer.
Wells and Hawley will face each other in a runoff.
Creighton was elected Secretary-Treasurer.
Wells and Creighton will face each other in a runoff.
Wells was elected Secretary-Treasurer.
Wells was elected Secretary-Treasurer.
The third-largest portion of the circle graph is gray, which, according to the legend, corresponds to Wells's share of the vote. Wells was elected Secretary-Treasurer outright.
Example Question #2 : Tables
Below is a table that gives the population of Washington City for six census years.

Which of the following decades saw the greatest growth in the city's population?
1980 to 1990
1960 to 1970
2000 to 2010
1970 to 1980
2000 to 2010
For each decade, take the difference of the population of the last year and that of the first year. We can omit 1990 to 2000, as the population declined over that decade.
1960-70:

1970-80:

1980-90:

2000-10:

The greatest growth occurred between 2000 and 2010.
Example Question #11 : How To Find The Answer From A Table
Mrs. Smith’s class made a line plot to show the amount of sugar that each student has in a given day.
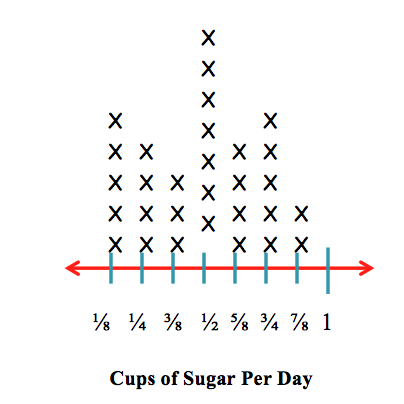
How many students have 


Each X represents one person. There are 

Example Question #1535 : Common Core Math: Grade 5
Mrs. Smith’s class made a line plot to show the amount of sugar that each student has in a given day.
How many students have 


Each X represents one person. There are 

Example Question #202 : Data Analysis And Probability
Mrs. Smith’s class made a line plot to show the amount of sugar that each student has in a given day.
How many students have 


Each X represents one person. There are 

Example Question #4 : Make A Line Plot To Display A Data Set Of Measurements In Fractions And Solve Problems: Ccss.Math.Content.5.Md.B.2
Mrs. Smith’s class made a line plot to show the amount of sugar that each student has in a given day.
How many students have 


To solve this problem, we have to add the number of Xs above the 

There are 


Example Question #5 : Make A Line Plot To Display A Data Set Of Measurements In Fractions And Solve Problems: Ccss.Math.Content.5.Md.B.2
Mrs. Smith’s class made a line plot to show the amount of sugar that each student has in a given day.
How many students have 


To solve this problem, we have to add the number of Xs above the 

There are 


Example Question #11 : Tables
The table below gives the number of students who scored in each of five ranges on a standardized test.

No student scored below 
What percent of the students scored 


More information is need to answer the question.


Add the students who finished in the bottom two ranges (


Now add all the students from all five ranges:

To figure out what percent of all of the students finished in the bottom two ranges, calculate:

The correct choice is 
Example Question #12 : Tables
Mrs. Smith’s class made a line plot to show the amount of sugar that each student consumes in a given day.
How many students consume 


Each X represents one person. There are 


Certified Tutor

Certified Tutor

All SSAT Middle Level Math Resources

