SSAT Middle Level Math : Data Analysis
Study concepts, example questions & explanations for SSAT Middle Level Math


All SSAT Middle Level Math Resources
Example Questions
Example Question #171 : Data Analysis
Complete the table below using the equation


In order to solve this question, we need to use both the equation and the table. We are looking for the corresponding 


+3")


Example Question #22 : Sets


The pattern for the set is all even numbers up until 


Example Question #23 : Sets
What number replaces the circle in the sequence below?


Add 23 to the first element to get the second element. The increment decreases by two with each successive entry. The pattern can be seen below:


To get the element in the circle, add 15:

This is confirmed by adding 13;

Example Question #172 : Data Analysis
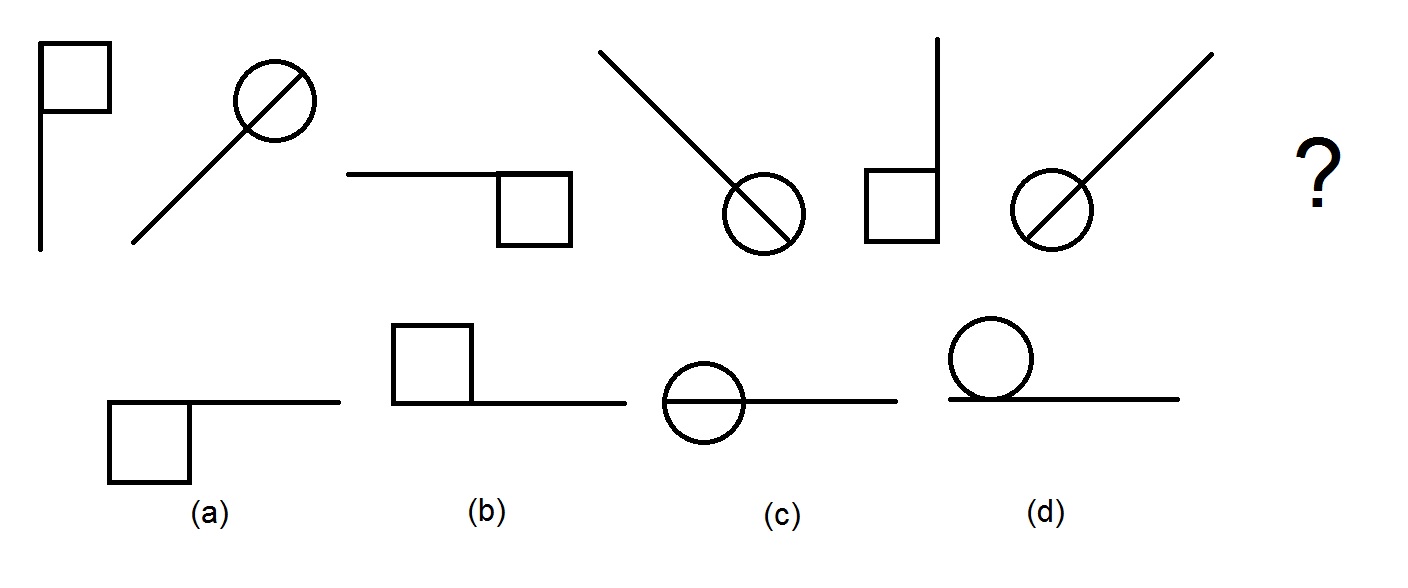
Refer to the above diagram. The top row gives a sequence of figures. Which figure on the bottom row comes next?
Figure (d)
Figure (b)
Figure (c)
Figure (a)
Figure (b)
The figures alternate between lines with squares and lines with circles, so the next figure must be a line with a square. This eliminates Figures (c) and (d) and leaves Figures (a) and (b).
If we only look at every other figure - the ones with the squares - we note that each figure is the previous one rotated one quarter turn clockwise. The next figure in the sequence is therefore the figure resulting from a one-quarter turn of the fifth figure - this is Figure (b).
Example Question #172 : Data Analysis
What number replaces the square in the sequence below?


The way to get from one entry of the sequence to the next alternates between multiplying by four and subtracting one, as follows:


Continuing the pattern:


Example Question #173 : Data Analysis
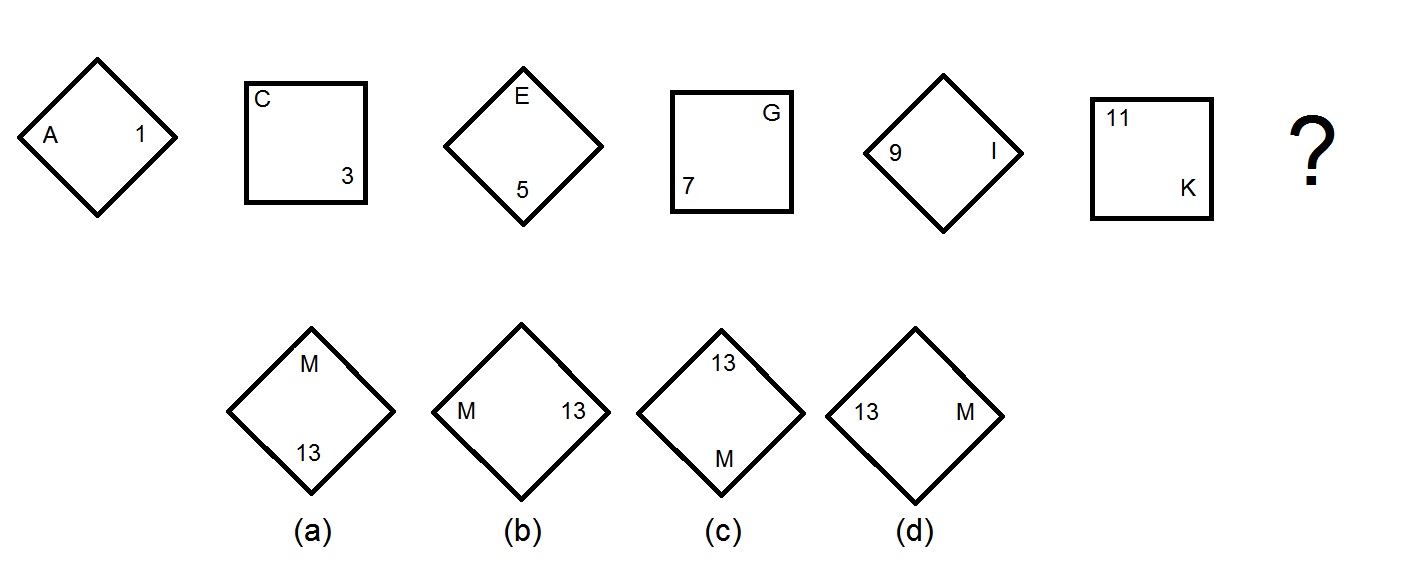
On the top row in the above diagram is a sequence of figures. Which of the figures in the bottom row is the next one in the sequence?
Figure (a)
Figure (d)
Figure (b)
Figure (c)
Figure (c)
Each figure is obtained by rotating the previous figure one-eighth of a turn clockwise, with the position of the letter and the number also so changed. Also, the number increases by two, and the letter, which is always in the opposite corner, is the letter corresponding to the number (A = 1, C = 3, etc...).
The next number in the pattern is 13; the thirteenth letter in the alphabet is "M"; and, to continue the pattern of rotating one-eighth of a turn clockwise each time, the "M" must be at the very bottom, with the "13" being at the top. This means that Figure 3 is the next figure in the sequence.
Example Question #1 : Analyzing Graphs And Figures

Four candidates ran for mayor of Jackson City; the above circle graph shows the share of the vote that each won.
According to a city ordinance, a candidate must win more than 50% of the vote to win the election; if this does not happen, the two candidates who win the most votes will face each other in a runoff election. Based on the above graph, which of the following is the outcome of the vote?
Mills won the election outright.
Mills and King will face each other in a runoff.
Jones and King will face each other in a runoff.
Mills and Jones will face each other in a runoff.
Jones won the election outright.
Mills and Jones will face each other in a runoff.
By comparing the sizes of the sectors, it can be seen that Mills won the largest share of the vote - but not at least one half of it - and Jones won the second-largest share. Therefore, they will face each other in a runoff.
Example Question #3 : Graphing
Four candidates ran for mayor of Johnston City. The results are below.

Which of the following is the best estimate of the percent of the vote won by Johnson?


Since we are asking for an estimate, one way to work this problem is to round each candidate's vote tally to the nearest thousand, then adding the rounded numbers:


Johnson's share of the vote is about 6,000 of those approximately 14,000 votes, or

As a percent, 


Therefore, 40% is the best estimate of the choices we are given.
Example Question #1 : Analyzing Graphs And Figures
Five candidates ran for mayor of Madison City; the above circle graph shows the share of the vote that each won. Which of the following would be the most reasonable estimate of the percent of the vote Lyle won?


The sector representing Lyle is roughly one-tenth to one-eighth of the circle - in other words, 10-12 % of it. This is the approximate percent of the vote won by Lyle.
Example Question #2 : How To Find The Answer From A Table
Four candidates ran for mayor of Johnston City. The results are below.

According to a city ordinance, a candidate must win more than 50% of the vote to win the election; if this does not happen, the two candidates who win the most votes will face each other in a runoff election. Based on the above table, which of the following is the outcome of the vote?
A runoff will be held between Allen and Carter.
A runoff will be held between Johnson and Carter.
Allen won outright.
A runoff will be held between Johnson and Allen.
Johnson won outright.
A runoff will be held between Johnson and Allen.
We can determine whether the highest vote-getter, Johnson, won the election outright by comparing Johnson's votes to the sum of the votes of his opponents. The votes won by his opponents sum up to:

Johnson won 5,813 votes. Since 


All SSAT Middle Level Math Resources

