All SSAT Middle Level Math Resources
Example Questions
Example Question #221 : Data Analysis And Probability

Using the Venn diagram above shows whether respondents only like Super Hero 

The total number of survey respondents is equal to 
Thus, the solution is:
Example Question #1 : How To Find The Common Part With A Venn Diagram

The Venn diagram shown above displays whether respondents only use Social Media site 

What percent of respondents use both Social Media sites?
The total number of survey respondents is equal to 
Example Question #4 : Venn Diagrams

What fraction represents the amount of respondents that use both Social Media site 

The total number of survey respondents is equal to 
Example Question #10 : How To Find The Common Part With A Venn Diagram

The above Venn diagram shows the amount of survey respondents that only like tacos, only like tamales, and those that like both tacos and tamales.
What fraction of respondents like both tacos and tamales?
The total number of survey respondents is equal to 

The total number of respondents that do not like both tacos and tamales: 
The remaining amount equals the respondents that like both tacos and tamales.
Thus, the solution is:
Example Question #11 : How To Find The Common Part With A Venn Diagram

The above Venn diagram shows the amount of survey respondents that only like tacos, only like tamales, and those that like both tacos and tamales.
What percent of the respondents like both tamales and tacos?
The total number of survey respondents is equal to 

The total number of respondents that do not like both tacos and tamales: 
The remaining amount equals the respondents that like both tacos and tamales.
Thus, the solution is:
Now we need to convert the fraction into a percent.

Example Question #12 : How To Find The Common Part With A Venn Diagram

The above Venn diagram shows the results from a recent survey. Respondents had the choice of being only a fan of TEAM 

In order to find the value of the common area of this Venn diagram, find the sum of 

Then find the difference from the sum to 
The solution is:
Example Question #211 : Data Analysis

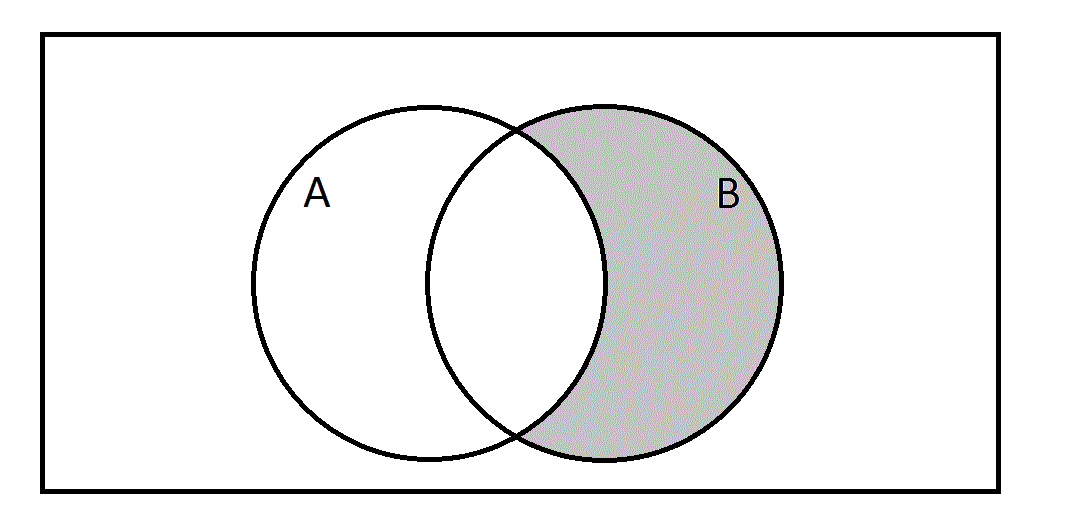
See the above Venn diagram. Which of the following sets is represented by the gray region?
The shaded area represents the set of all elements that are both in 


Example Question #212 : Data Analysis

See the above Venn diagram. Which of the following sets is represented by the gray region?
The gray region represents all elements that either are in 


Example Question #1 : Venn Diagrams
Given the Venn diagram below, which of the following does not belong to 

The symbol 

Example Question #1 : Data Analysis

Let set 


Which of the following numbers would appear in the gray region of the Venn diagram?
The gray area represents the portion of 


Therefore, 4,572, 3,438, and 8,544 can be eliminated.


All SSAT Middle Level Math Resources


