SAT Mathematics : SAT Math
Study concepts, example questions & explanations for SAT Mathematics


All SAT Mathematics Resources
Example Questions
Example Question #561 : Sat Math
List X: 10, 12, 14, 16, 18
List Y: 12, 13, 14, 15, 16
Which of the following best describes the two lists of numbers above?
The means are different, and the standard deviations are different.
The means are the same, and the standard deviations are the same.
The means are the same, and the standard deviations are different.
The means are different, and the standard deviations are the same.
The means are the same, and the standard deviations are different.
Both lists have the same mean value of 14, a fact you can determine by adding each list (the sum of each is 70) and dividing by the number of terms (each list has five terms). Or you can find this by inspection: List X is a set of consecutive even numbers and List Y is a set of consecutive integers, and in any evenly-spaced set the mean is equal to the median, which for each list is 14.
The standard deviations are different, however, and you can determine this without having to calculate. Standard deviation is a measure of how far the terms stray from the mean. Here you can see that List X is farther spread from the mean while List Y is closer to the mean, so you know that List X has a larger standard deviation.
Example Question #562 : Sat Math
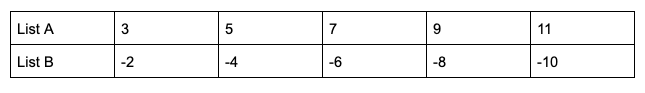
Lists A and B each contain five values as displayed in the table above. Which of the following best describes the two lists?
The means are different, and the standard deviations are the same.
The means are different, and the standard deviations are different.
The means are the same, and the standard deviations are the same.
The means are the same, and the standard deviations are different.
The means are different, and the standard deviations are the same.
This problem tests two important statistical concepts: mean and standard deviation. Note that you are expected to know how to calculate the mean of a set of numbers: it’s the sum of the values divided by the number of values. Here, however, you may not need to go to all that trouble. You know that each list has five terms, and you also know that the sums are completely different: List A’s sum is positive and List B’s is negative. So just based on the the means are different, although you could also calculate and find that the means are 7 for List A and -6 for List B.
For standard deviation, the SAT won’t ask you to actually calculate the standard deviation, but you should understand it conceptually as a measure of how far the data points stray from the mean. For these lists, notice that the differences from the mean are all the same:
List A: 3 and 11 are each 4 away from the mean; 5 and 9 are each 2 away; and 7 is 0 away.
List B: -2 and -10 are each 6 away from the mean; -4 and -8 are each 2 away; and -6 is 0 away.
So the standard deviations for the two lists are exactly the same.


All SAT Mathematics Resources

