SAT Mathematics : SAT Math
Study concepts, example questions & explanations for SAT Mathematics


All SAT Mathematics Resources
Example Questions
Example Question #551 : Sat Math
The average (arithmetic mean) of 16 students’ first quiz scores in a difficult English class is 62.5. When one student dropped the class, the average of the remaining scores increased to 64.0. What is the quiz score of the student who dropped the class?
70
40
55
25
40
Solving this problem requires finding the sum of the grades before the dropout and then after the dropout. The difference between those two sums is the answer. To do that, first consider the sum before the dropout: the average of 62.5 times the number of students, which is 16. Use some clever mental math to do this quickly: 16 x 62 = 16 x 60 + 16 x 2 = 960 + 32 or 992. Then add the .5 x 16 or 8 to get an even 1000. Even better, recognize that 62.5 is 

(16)=1000")
Lastly, calculate the sum after the drop: the average of 64 times the number of students, which is 15. Again, use some mental math to do this efficiently: 15 x 64 = 10 x 64 + 1/2 of that value or 640 + 320 = 960. The difference between 1000 and 960 is 40.
Example Question #7 : Working With Statistics
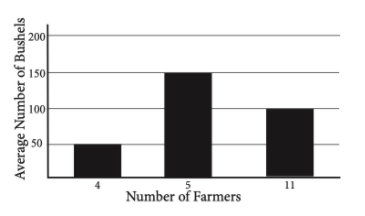
Each of 20 farmers reported the average output of their apple orchards, in bushels per acre. The results of this report were graphed on the histogram above. What is the average number of bushels per acre harvested by the farmers?
110
102.5
96.2
100
102.5
When you are asked to find an average from a histogram, remember that there are two dimensions of information you need to deal with – the number of individuals with each response, and the response given. It is not enough to find the average of 50, 150, and 100 – there are multiple people with each response. You must find the total number of bushels reported by the farmers and then average those.
Remember that the average of a set of numbers can be computed as:

To find the sum, simply multiply the number of farmers with each response by the value of that response. With 4 farmers who responded 50, 5 farmers who responded 150, and 11 farmers who responded 100, that means your sum is 4(50) + 5(150) + 11(100) = 2050.
When you divide the sum, 2050, by the number of terms, 20, you get the answer 102.5.
Example Question #13 : Probability & Statistics
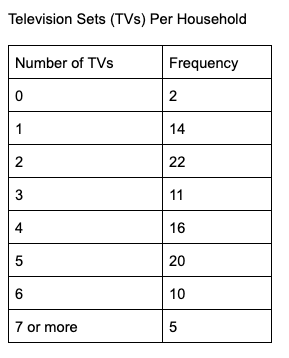
The table above shows the number of television sets that each household, out of 101 total households, in a neighborhood possesses. Based on the table, what is the median number of television sets per household?
3.5
3
2
4
4
The median value is the middle number in a data set, and here you’re told that there are 101 total values, meaning that the 51st value will be the middle number. You can find the median, then, by looking for which number would be the 51st. Reading down the column with the number of households, you can see that 2 (the number of zero-TV households) + 14 (one TV) + 22 (two TVs) + 11 (three TVs) gives you 49 households with 0, 1, 2, or 3 TVs. That means that the 51st value has to be one of the 4-TV households, making the correct answer 4.
Note that frequency tables such as this are a great way to display large data sets, but it takes some familiarity to interpret them properly. Look at the first two rows: 2 households had 0 TVs and 14 households had 1. If we were to list the numbers of TVs for each household, our list would look like:
0, 0, 1, 1, 1, 1, 1, 1, 1, 1, 1, 1, 1, 1, 1, 1…
Visually to show all the data we’d need an even-longer list, so the frequency table is a nice summary, but if you don’t quite see how the answer is 4, you could continue this list with twenty-two 2s, eleven 3s, etc. and then count to find the 51st value. But be warned that 1) that’s time consuming and 2) the SAT does test frequency tables, so it’s a good idea to get used to them.
Example Question #9 : Working With Statistics
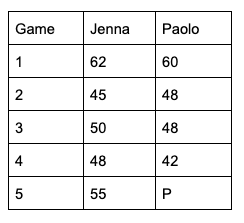
The table above displays the scores for Jenna and Paolo as they played against each other five times in a certain game. If Jenna’s mean score for the set of five games was 2 points higher than Paolo’s mean score, what is the value of P, Paolo’s score for the fifth game?
52
53
50
51
52
There are a few ways that you can solve this problem. One is to simply calculate each player’s mean score. That means taking the sum of each of their scores and dividing by 5. For Jenna, that’s 62 + 45 + 50 + 48 + 55 = 260, which when divided by 5 gives you 52.
Since her mean score is 52, that means that Paolo’s mean score must be 50, so his equation is then:

Then you can solve algebraically by multiplying both sides by 5:
250 = 60 + 48 + 48 + 42 + P
250 = 198 + P
52 = P
Or you can take a shortcut: if you realize that for Jenna’s mean score to be 2 points higher, and that over 5 games that means she needs to have scored 10 total points more, you can scan the table and just pay attention to how far Jenna is cumulatively ahead of Paolo:
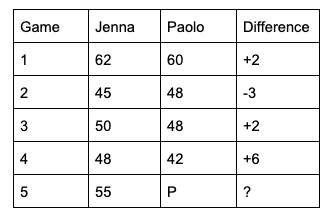
You can see then that before Game 5, Jenna is a total of 7 points ahead, meaning that her Game 5 score of 55 must be 3 higher than Paolo’s so that she’s a total of 10 points ahead. So Paolo’s P must be 52.
Example Question #10 : Working With Statistics
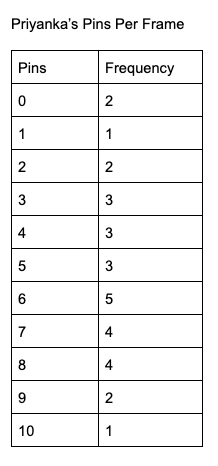
At a bowling party, Priyanka bowled a total of 30 frames. The table above shows how many pins she knocked down per frame. What was the median number of pins she knocked down?
6
5
3
4
6
The median value of a data set is the middle term, provided that there is an odd number of terms, or the average of the two middle terms if there is an even number of terms. Here you’re told that there will be 30 data points, so the median will be the average of the 15th and 16th terms.
The way a frequency table works is to show you how often (frequency) each number appears in the data points. Here that means that you start with two 0s, one 1, two 2s, etc. Since you’re looking for the 15th and 16th terms, you can start adding the frequencies until you get to that term. The first five totals (for pins 0 through 5) sum to 14, meaning that the 15th and 16th values will be 6. This means that the median is 6.
Note that a frequency table is a convenient way to summarize lots of data points; without the table, your data set would look like this:
0, 0, 1, 2, 2, 3, 3, 3, 4, 4, 4, 5, 5, 5, 6, 6, 6, 6, 6, 7, 7, 7, 7, 8, 8, 8, 8, 9, 9, 10
That’s a lot of individual data points, which is why frequency tables are so useful, and why the SAT frequently tests them.
Example Question #21 : Probability & Statistics
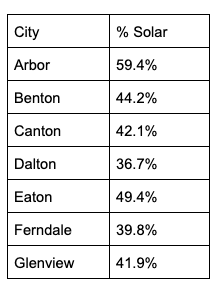
The table above displays, for seven cities in a certain state, the percentage of household electricity that comes from solar power. For the state as a whole, the median percentage is 44.9%. What is the difference between the statewide median percentage and the median percentage for these seven cities?
0.7%
3.0%
2.8%
8.2%
2.8%
The median is the middle value in a set of data, so for this set of 7 cities’ data you’re looking for the 4th value once the values are arranged in order. The values in order are:
36.7, 39.8, 41.9, 42.1, 44.2, 49.4, 59.4
So the 4th/middle term is 42.1. Since the question asks for the difference between the median and 44.9, you subtract 44.9 - 42.1 to get the answer of 2.8.
Example Question #552 : Sat Math
Rory is 3 years older than Joe, and Andrea is 2 years older than Rory. If Andrea is 24 years old, what is the median age of these three people?
22
20
21
19
22
With only three ages in play here, your best bet is likely to use the given information to calculate each age and then select the middle one as the median. You're given that:
1) Andrea is 24
2) Andrea is 2 years older than Rory
So you can calculate that Rory is 24 - 2 = 22 years old.
3) Rory is 3 years older than Joe, so Joe is 22 - 3 = 19 years old.
With ages of 19, 22, and 24, the median age is 22.
Example Question #553 : Sat Math
Sales associate Danielle has a weekly goal to average 75 phone calls per day. If her average for the first four days of a five-day workweek was 72 phone calls per day, how many phone calls does she need to make on the fifth day to reach her goal?
75
81
78
87
87
Average is calculated as 
The number of terms will be 5, as you're told that it is a five-day work week. And the sum of the terms also involves the average calculation: if you multiply both sides of the average equation by "number of terms," you can find the sum:

Since you know Danielle's four-day average, you can calculate her current sum by multiplying 72 × 4 = 288.
This means that her total number of calls for the week will be 


When you multiply both sides by 5 you get:

So you can then subtract 288 from both sides to get:

Alternatively (and this is much easier on this problem as you avoid the somewhat tedious sum calculations) you can simply consider how far the first four days are below the required average. Since 72 is 3 below the required average of 75 you know that Danielle has a deficit of 12 (4 × 3) going into the last day. She must therefore make the required average of 75 + the deficit of 12 or 87 calls.
Example Question #551 : Sat Math
At a bowling alley, Neil can win a free pair of bowling shoes if he averages a score of at least 200 over 8 games. If his scores in his first seven games were 192, 188, 195, 197, 205, 208, and 203, what is the minimum score he needs in his last game to win the shoes?
199
212
205
201
212
While the rule for calculating an average is to take the sum of the terms and divide by the number of terms, in practice that can lead to cumbersome calculations in a case like this. You could calculate (192 + 188 + 195 + 197 + 205 + 208 + 203 + x), then say that that sum divided by 8 equals 200. But that's a lot of addition that you don't have to do.
What you really want to know is how far away Neil is from his goal of 200 per game. And with the numbers you're given, you can pair off values that net to an average of 200. For example, that list contains 195 and 205: the average of those two is 200, so you can pair those off and say that with those two scores he's on pace to his goal. If you do that with the available numbers, you'll pair off:
192 and 208
195 and 205
197 and 203
And then you're just left with 188. So going into his last game, Neil is 12 points short of being on track for his goal. He'll need to balance that out with a score 12 points above his goal, so he must get at least a 212.
Example Question #553 : Sat Math
List X: 10, 12, 14, 16, 18
List Y: 12, 13, 14, 15, 16
Which of the following best describes the two lists of numbers above?
The means are different, and the standard deviations are the same.
The means are the same, and the standard deviations are different.
The means are different, and the standard deviations are different.
The means are the same, and the standard deviations are the same.
The means are the same, and the standard deviations are different.
Both lists have the same mean value of 14, a fact you can determine by adding each list (the sum of each is 70) and dividing by the number of terms (each list has five terms). Or you can find this by inspection: List X is a set of consecutive even numbers and List Y is a set of consecutive integers, and in any evenly-spaced set the mean is equal to the median, which for each list is 14.
The standard deviations are different, however, and you can determine this without having to calculate. Standard deviation is a measure of how far the terms stray from the mean. Here you can see that List X is farther spread from the mean while List Y is closer to the mean, so you know that List X has a larger standard deviation.


All SAT Mathematics Resources

