SAT Math : How to find the probability of an outcome
Study concepts, example questions & explanations for SAT Math


All SAT Math Resources
Example Questions
Example Question #291 : Data Analysis
Forty balls are placed in a large box, each marked with a whole number from 1 to 40. The balls marked with an even number or a prime number are all blue; the other balls are red.
Two balls are drawn without replacement. Give the probability that both will be red.


The odd composite numbers - that is, the odd numbers that have more than two factors - are all represented by red balls. The odd composite whole numbers in the set 

We can assume that the two balls are drawn one at a time. The probability of the first ball being red is 


This is the probability that both balls will be red.
Example Question #131 : Probability

A popular word game has 100 square tiles. Each is marked with a letter or a blank; the distribution of the letters is seen in the table above. Note that two of the tiles are blanks.
Two letters are drawn at random from the set of tiles. What is the probability that both tiles will be marked with a letter from the first half of the alphabet?
None of the other choices gives the correct response.


Add the numbers of tiles corresponding to each of the letters from "A" to "M":

The probability that one of these tiles will be drawn on the first draw is 


Example Question #291 : Data Analysis
A popular word game has 100 square tiles. Each is marked with a letter or a blank; the distribution of the letters is seen in the table above. Note that two of the tiles are blanks.
Two letters are drawn at random without replacementfrom the set of tiles. What is the probability that neither tile is marked with a consonant?
(Note: "Y" is considered a consonant for purposes of this problem.)


Out of the 100 tiles, there are 9 tiles marked with "A", 12 with "E", 9 with "I", 8 with "O", and 4 with "U", as well as 2 blank tiles; this is a total of

tiles not marked with a consonant.
The probability that the first draw will result in a vowel or a blank is 
After this draw, there will be 99 tiles, 43 of which are vowels or blanks; the probability that the second draw will be one of these is 
Use the multiplication principle to find the probability that both tiles will be vowels or blanks:

Example Question #294 : Data Analysis
A six-sided die is rolled twice. What is the probability that the first roll will land on an odd number, and the second roll will land on a even number?


A six-sided die has three sides with odd numbers and three sides with even numbers. Thus, the probability of the die landing on an odd number is

which simplifies to

The probability of the die landing on an even number is also

which we can simplify to

Because the probabilities are independent of each other, we can find the probability of the two events happening in a row by multiplying the fractions.
(\frac{1}{2})=(\frac{1}{4})")
Therefore, the probability of the first roll landing on an odd number, and the second roll landing on an even number is 
Example Question #2 : How To Find The Probability Of An Outcome
You went to order a cake but all of the cakes are in identical boxes. If there are five chocolate cakes, four carrot cakes, three vanilla cakes, and six red velvet cakes, what is the maximum number of boxes that you would have to open to ensure that you have one of each type of cake?
16
12
9
4
16
There are four different types of cake. In this type of problem we want to guarantee we have one of each, so we need to assumbe we have very bad luck. We start with the red velvet since that is the type with the most cakes. If we open those 6 we are not guaranteed to have different ones. Then say we opened all five chocolate cakes, then all four carrot cakes. We still have only three types of cakes but opened 15 boxes. When we open the next box (16) we will be guaranteed to have one of each.
Example Question #296 : Data Analysis
What is the probability of drawing either an ace, a king, or a jack from a standard deck of playing cards?


Remember that the "probability" of an event happening is the number of outcomes which result in that event divided by the total number of possible outcomes. That is,

Hence, the probability of an event happening is described as a fraction. To solve this problem, we must first recognize that three separate events are being described: drawing an ace, drawing a king, and drawing a jack. Because each of these events do not overlap (you cannot, for example, draw a card that is both a jack and a king at the same time), calculating the probability ")
")
")
")
There are 


=\frac{4}{52}")
=\frac{4}{52}")
=\frac{4}{52}")
and therefore
=P(A)+P(K)+P(J)")


This means that the probability of drawing either an ace, a king, or a jack from a standard deck of playing cards is 
Example Question #131 : Outcomes
Mrs. Smith assigns homework to her class once a week and records each student's results. For last week's assignment, the histogram depicts these results. If the homework set was worth twenty points, what is the range of grades for last week's assignment?
Note: For each error, one point is subtracted from the total points possible.
To solve this problem, first identify what the highest and lowest grade on the assignment was. The highest grade will be the one with the least amount of errors made and the lowest grade will be the one with the most amount of errors made.
The red bar in the histogram says that students made between zero and two errors. In other words, either: 0, 1, 2 errors.
The yellow bar in the histogram says that the students made between two and four errors. Since the red bar includes two errors the yellow bar only includes 3 or 4 errors.
The green bar in the histogram says that students made 5 or 6 errors.
The teal bar in the histogram says that students made 7 or 8 errors.
The blue bar in the histogram says that students made 9 or 10 errors.
The purple bar in the histogram says that students made 11 or 12 errors.
This means that at least one student made zero errors on the assignment and therefore did not loose any points. Therefore, the highest grade on the assignment was twenty.
The histogram shows that at least one student made twelve errors on the test. Therefore, the lowest grade on the assignment would be:

From here, calculate the range.

Example Question #3 : How To Find The Answer From A Table
Use the following table to answer the question.

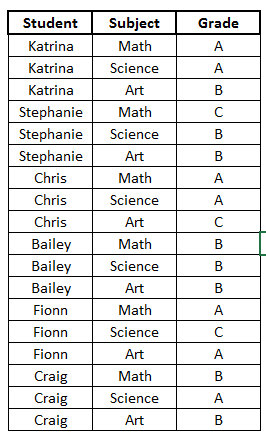
How many students received an A in math?


When looking at the table
we can see that is shows several students and within the subjects of Math, Science, and Art what grades those students received in those classes.
So, going over the table briefly, we can see the first student Katrina. We see for Math she received an A. For science, Katrina received an A. And for Art, Katrina got a B. We can read the table similarly for the remaining students.
Now, the question asks how many students received an A in math. So we will look through the table and locate Math. Once we locate Math, we will look at the grade that corresponds with it (In this example, we do not care about who the student is. We just care about the grade). So, we will count the number of A's we see matched up to the subject Math.
Once we do that, we see there are 3 students who received A's in Math (Katrina, Chris, and Fionn).
Example Question #301 : Data Analysis
Use the following table to answer the question.

What class did Craig have the highest grade in?


Let's look at the table.
We can see the first column lists all the students. The next column shows all of the classes. And the last column shows the grade they received in those classes.
Now, to find which class Craig received the highest grade, we must first locate Craig. We can see all of Craig's classes are at the very bottom of the table.
Now, we will look at the grade he got in each class by following along the rows with Craig's name.
We can see Craig's first class is Math. He received a B.
Craig's second class is Science. He received an A.
Craig's third class is Art. He received a B.
Knowing this, we can see the highest grade Craig received was an A. The class where he received an A was Science.
Therefore, the class that Craig received the highest grade was Science.
Example Question #301 : Data Analysis
Use the following table to answer the question:
What grade did Chris receive in Science?


To answer the question, let's look at the table.
We can see the first column shows the different students, the next column shows the classes they are in, and the last column shows their grade in the class.
Now, to find what grade Chris received in Science, we will first locate Chris' name in the first column.
Now, we can see his name appears 3 times. If we look to the right, we can see his name matches up to 3 different classes: Math, Science, and Art. We want to know his grade in Science, so we will choose that row.
We will again look to the right to see the grade. We can see that it says A.
Therefore, the grade that Chris received in Science was an A.


All SAT Math Resources

