ISEE Middle Level Quantitative : Data Analysis
Study concepts, example questions & explanations for ISEE Middle Level Quantitative


All ISEE Middle Level Quantitative Resources
Example Questions
Example Question #6 : Tables
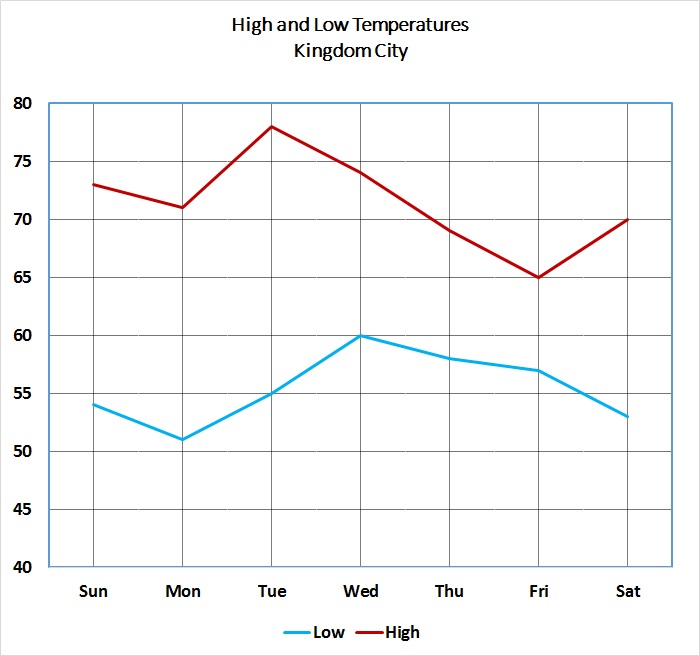
Refer to the above graph, which shows the high and low temperatures for Kingdom City over a one-week period.
On how many days did the temperature fall below 55 degrees?
Four
Three
Two
One
Three
To answer this question, examine the line representing the low temperatures.
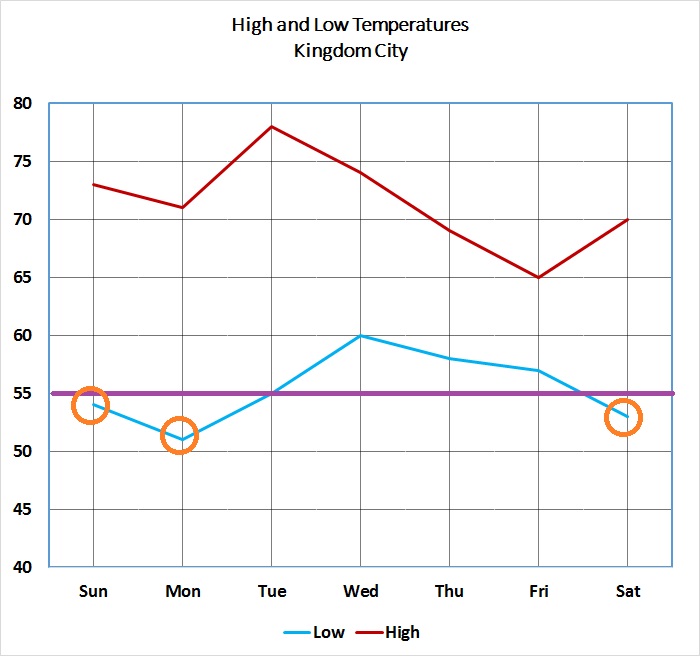
Notice that the three days on which the temperature fell below 55 have been marked with a circle (the low temperature on Tuesday was exactly 55).
Example Question #8 : How To Find The Answer From A Table
Refer to the above graph, which shows the high and low temperatures for Kingdom City over a one-week period.
On how many days did the difference between the high and low temperatures reach or exceed fifteen degrees?
Seven
Five
Four
Six
Four
Below is the graph, this time with the temperatures represented.
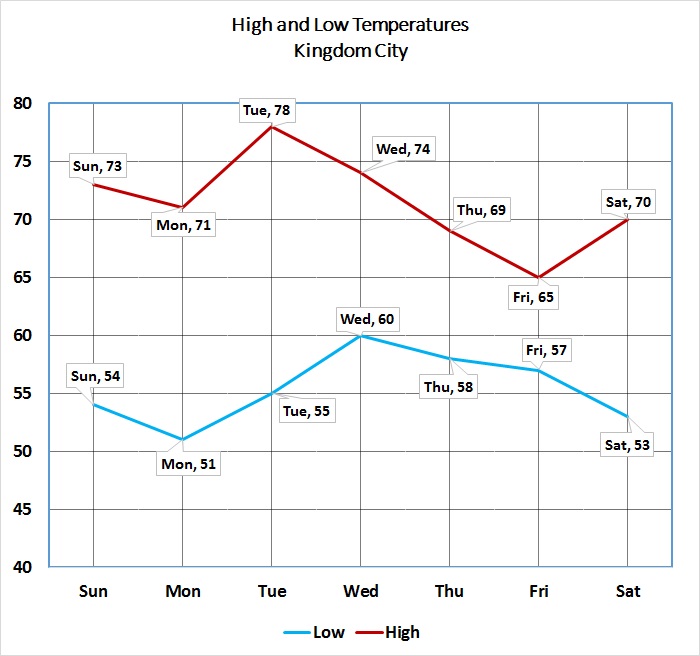
The differences between the high and low temperatures for each day are as follows:
Sunday:

Monday:

Tuesday:

Wednesday:

Thursday:

Friday:

Saturday:

The differences for four days - Sunday, Monday, Tuesday, and Saturday - all exceed 15 degrees.
Example Question #1 : How To Find The Answer From A Table
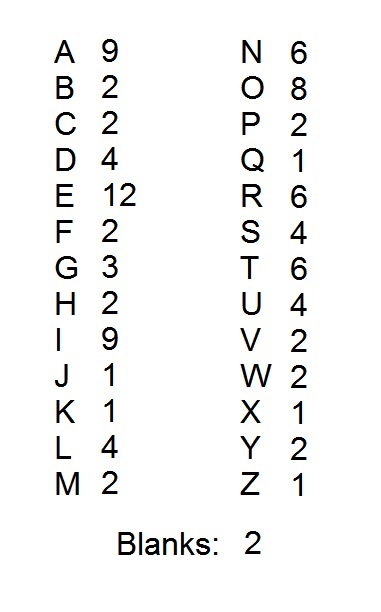
A popular word game uses one hundred tiles, each of which is marked with a letter or a blank. The distribution of the tiles is shown above, with each letter paired with the number of tiles marked with that letter. Notice that there are two blank tiles.
How many consonants are represented by as many tiles as there are "U" tiles?
(Note: for this problem, "Y" is considered a consonant)
Three
Five
Four
Two
Three
According to the table, there are four "U" tiles. The consonants represented by exactly four tiles are "D", "L, and "S" - three different consonants.
Example Question #101 : Data Analysis
Refer to the above graph, which shows the high and low temperatures for Kingdom City over a one-week period.
On how many days did the temperature exceed 70 degrees?
Seven
Four
Five
Six
Four
To answer this question, examine the line representing the high temperatures.

Notice that the four days on which the temperature fell above 70 have been marked with a circle (the high temperature on Friday was exactly 70).
Example Question #221 : Data Analysis And Probability
Use the chart below to answer the question.

How many students in Mr. Ray's class have a pet?


Each square represents 


Example Question #222 : Data Analysis And Probability
Use the chart below to answer the question.
How many students in Ms. Smith's class have a pet?


Each square represents 


Example Question #2 : Representing And Interpreting Data
Use the chart below to answer the question.
How many students in Ms. Hen's class have a pet?


Each square represents 


Example Question #81 : How To Find The Answer From A Table
Use the chart below to answer the question.
How many students in Ms. Miller's class have a pet?


Each square represents 


Example Question #4 : Answer Questions Using Information From A Bar Graph: Ccss.Math.Content.3.Md.B.3
Use the chart below to answer the question.
How many more students have a pet in Mr. Ray's class than Ms. Miller's class?


Each square represents 


To find the difference we subtract.

Example Question #142 : Data Analysis And Probability
Use the chart below to answer the question.
How many more students have a pet in Mr. Ray's class than Ms. Hen's class?


Each square represents 


To find the difference we subtract.


Certified Tutor

Certified Tutor

All ISEE Middle Level Quantitative Resources

