ISEE Lower Level Quantitative : Tables
Study concepts, example questions & explanations for ISEE Lower Level Quantitative


All ISEE Lower Level Quantitative Resources
Example Questions
Example Question #1 : Tables
Use the following table to determine the cost of purchasing two books.
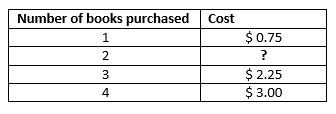


The relationship between the values is 
where 

Once we realize this, we can determine how much purchasing two books ")
=1.50")
Example Question #1 : Tables
Use the table to determine how much one cupcake would cost.
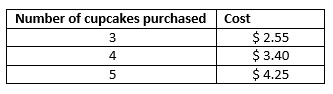


We can determine the relationship between the values by creating a ratio of number of cupcakes to cost:

Where 
We can now solve for 
(x)=(2.55)(1)")

The cost of one cupcake is then $0.85
Example Question #3 : Tables
The following table consists of the test grades from 

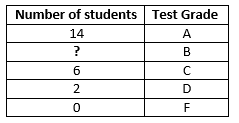


We were told the grades are from 

We know there is a total of 


So the missing value is eight.
Example Question #1 : Tables
Use the table to determine how much one cupcake would cost.


We can determine the relationship between the values by creating a ratio of number of cupcakes to cost:
Where
We can now solve for
The cost of one cupcake is then


Certified Tutor


All ISEE Lower Level Quantitative Resources

