ISEE Lower Level Math : Data Analysis
Study concepts, example questions & explanations for ISEE Lower Level Math


All ISEE Lower Level Math Resources
Example Questions
Example Question #1 : Data Analysis
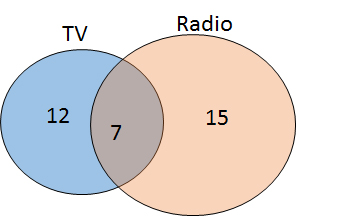
Students were asked if they prefer TV or radio. The following Venn Diagram depicts the number of students who said TV, radio, or both. How many students like both TV and radio?
7
22
12
15
7
The blue circle of the Venn diagram depicts the number of students who prefer TV, the orange circle depicts the number of students who prefer radio, and the region of overlap indicates the number of students who like both. Therefore, 7 students like both TV and radio.
Example Question #91 : Data Analysis And Probability
Twenty-five students are surveyed. Twelve students like math, fifteen like science, and six don't like either subject. How many students like both math and science?


Start by removing the number who don't like either from the total number of students surveyed:

Using set notation we have:
=n(M)+n(S)-n(M\bigcap S)")
")
")
")
")


Example Question #2 : Data Analysis
Fifty people are surveyed at the zoo. Thirty-seven liked the Great Apes, twenty-two liked the Reptile House, and eleven didn't like either. How many people liked both the Great Apes and the Reptile House?


Start by removing the number who don't like either from the total number of people surveyed:

Using set notation we have:
=n(A)+n(R)-n(A\bigcap R)")
")
")
")
")


Example Question #92 : Data Analysis And Probability
Thirty people are surveyed concerning their color preference. Eighteen people like blue, twenty-one like pink, and six don't like either color. How many people like both colors?


Start by removing the number who don't like either from the total number of peole surveyed:

Using set notation we get:
=n(B)+n(P)-n(B\bigcap P)")
")
")
")
")


Example Question #1 : How To Find The Common Part With A Venn Diagram
Twenty-five students were surveyed concerning a classroom pet. Thirteen students wanted a lizard, fifteen wanted a frog, and five didnt want a pet at all. How many students wanted both a lizard and a frog?


Start by removing the number who don't like either from the total number of students surveyed:

Using set notation we get:
=n(F)+n(L)-n(F\bigcap L)")
")
")
")
")


Example Question #1 : Data Analysis
If Jill likes blue, yellow, tan and green, and Doug likes red, tan, black and green, which Venn diagram is correct?

The middle portion of the diagram is the area that both circles share, so the color name that belongs in both circles should go in the middle area. Doug and Jill both like green and tan, so those colors should go in the middle. Only Jill likes blue and yellow, so these go on Jill's side. Only Doug likes red and black, so these go on Doug's side.
Example Question #7 : Venn Diagrams
Use the following Venn Diagram to answer the question.
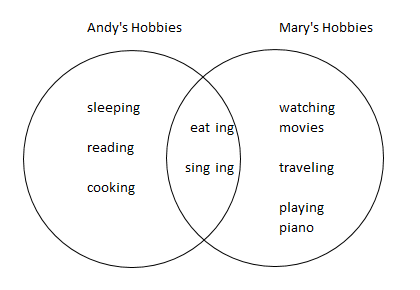
What hobbies to both Andy and Mary enjoy?


A Venn Diagram is made up of two circles. Each circle represents something, and the section where they intersect shows what those two circles have in common. So, in the Venn Diagram
we can see Andy's hobbies on the left and Mary's hobbies on the right. The section in the middle shows the hobbies Andy and Mary have in common.
So, to answer the question, what hobbies do Andy and Mary have in common, we can see that they both enjoy eating and singing.
Example Question #8 : Venn Diagrams
Use the following Venn Diagram to answer the question.

What hobbies do Andy and Mary have in common?


Let's look at the Venn Diagram.
We can see the first circle contains Andy's hobbies, and the second circle contains Mary's hobbies. The place in the middle, where the 2 circles intersect, shows the hobbies that both Andy and Mary enjoy. Or the hobbies they have in common. You can see they are a part of each person's circle.
So, the hobbies that are in the middle are eating and singing. Therefore, the hobbies that Andy and Mary have in common are eating and singing.
Example Question #2 : Data Analysis
Fifty people were surveyed. Twenty-three people liked the baseball team from Chicago, thirty-five like the baseball team from St. Louis, and ten don't like either team. How many people like both teams?


Start by removing the number who don't like either team from the total number of people surveyed:

Using set notation we get:
=n(Chicago)+n(St.Louis)-n(Chicago\bigcap St.Louis)")
")
")
")
")


Example Question #2 : Data Analysis
Define universal set 
Define sets 


Which of the following would be the set of all elements that would go into the grayed region in the above Venn diagram?


The grayed region is the set of all elements that are in 


All ISEE Lower Level Math Resources

