Common Core: High School - Functions : High School: Functions
Study concepts, example questions & explanations for Common Core: High School - Functions


All Common Core: High School - Functions Resources
Example Questions
Example Question #41 : Interpreting Functions
What is the end behavior of the following function?
=\frac{1}{x}")


This question is testing one's ability to grasp the relationship between a function algebraically, and the image it creates graphically. Problems like these are considered modeling problems because of their application. For example, the intercepts, extreme values, slope, symmetry, and end behavior for these functions mark key relationships between the inputs and the resulting outputs.
For the purpose of Common Core Standards, application of interpreting functions fall within the Cluster B of the function and use of function notation concept (CCSS.MATH.CONTENT.HSF-IF.B).
Knowing the standard and the concept for which it relates to, we can now do the step-by-step process to solve the problem in question.
Step 1: Identify what the question is asking.
This particular question is asking for the end behavior of the function. This means we will need to examine the graph of the function as the 
Step 2: Determine the approach to solve the problem.
I. Graphically plot the function using computer technology or graphing calculator.
Then, find the end behavior, 


Step 3: Interpret the above graph for the end behavior.
Looking at the graph above there appears to be a vertical asymptote and a horizontal asymptote. The vertical asymptote effects the behavior of the graph as the 


Step 4: Verify the solution algebraically.
Using the algebraic technique, plug in larger values for 
As 
\rightarrow 0")
Step 5: Answer question.
Example Question #42 : Interpreting Functions
What is the periodicity of the following function 
=4\sin(2x)+1")


This question is testing one's ability to grasp the relationship between a function algebraically, and the image it creates graphically. Problems like these are considered modeling problems because of their application. For example, the intercepts, extreme values, slope, symmetry, and end behavior for these functions mark key relationships between the inputs and the resulting outputs.
For the purpose of Common Core Standards, application of interpreting functions fall within the Cluster B of the function and use of function notation concept (CCSS.MATH.CONTENT.HSF-IF.B).
Knowing the standard and the concept for which it relates to, we can now do the step-by-step process to solve the problem in question.
Step 1: Identify what the question is asking.
This particular question is asking for the periodicity of the function
Step 2: Determine the approach to solve the problem.
I. Graphically plot the function using computer technology or graphing calculator.
II. Algebraically solve using the general formula, =aF(bx-c)+d")

Step 3: Using option II, the algebraic method to solve for the periodicity of the given function.

Therefore the periodicity is

Example Question #43 : Interpreting Functions

Find the interval where 
=(x+2)^5-2x")
")
")
")
")
This question is testing one's ability to grasp the relationship between the image a function creates graphically and the intervals where the function is increase, decreasing, positive, or negative. Problems like these are considered modeling problems because of their application. For example, the intercepts, extreme values, slope, symmetry, and end behavior for these functions mark key relationships between the inputs and the resulting outputs.
For the purpose of Common Core Standards, application of interpreting functions fall within the Cluster B of the function and use of function notation concept (CCSS.MATH.CONTENT.HSF-IF.B).
Knowing the standard and the concept for which it relates to, we can now do the step-by-step process to solve the problem in question.
Step 1: Identify what the question is asking.
This particular question is asking for where the function is decreasing. It is important to understand that when a function is decreasing, the graph exhibits a negative slope.
Step 2: Identify the intervals where the graph is negative (decreasing) and where it is positive (increasing).
Looking at the graph above, it is seen that ")

Step 3: Use algebra to find the decreasing interval of the function.
Looking at the possible answer selections, there are only two possible selections that contain two negative 
Option 1:
Option 2:
Lets convert the fractions into decimals.


Since 
")
Example Question #44 : Interpreting Functions
What is the relative minimum of the function 
=-4(x-1)^3+4x-1")
")
")
")
")
This question is testing one's ability to grasp the relationship between a function algebraically, and the image it creates graphically. Problems like these are considered modeling problems because of their application. For example, the intercepts, extreme values, slope, symmetry, and end behavior for these functions mark key relationships between the inputs and the resulting outputs.
For the purpose of Common Core Standards, application of interpreting functions fall within the Cluster B of the function and use of function notation concept (CCSS.MATH.CONTENT.HSF-IF.B).
Knowing the standard and the concept for which it relates to, we can now do the step-by-step process to solve the problem in question.
Step 1: Identify what the question is asking.
This particular question is asking for the relative minimum of the function.
Step 2: Determine the approach to solve the problem.
I. Graphically plot the function using computer technology or graphing calculator.
Then, find where the graph reaches its valley.
Step 3: For the purpose of this question let's solve using graphing calculator technology.
Graphing the function results in the following graph.

Looking at the above graph the valley occurs roughly at the point ")
Looking at the possible answer choices, there are only two options that contain a positive 

Option 1:
Option 2:
Since the 


Since


")
Example Question #45 : Interpreting Functions
What is the relative maximum of the following function?
=3x^3-5x+4")
")
")
")
")
")
This question is testing one's ability to grasp the relationship between a function algebraically, and the image it creates graphically. Problems like these are considered modeling problems because of their application. For example, the intercepts, extreme values, slope, symmetry, and end behavior for these functions mark key relationships between the inputs and the resulting outputs.
For the purpose of Common Core Standards, application of interpreting functions fall within the Cluster B of the function and use of function notation concept (CCSS.MATH.CONTENT.HSF-IF.B).
Knowing the standard and the concept for which it relates to, we can now do the step-by-step process to solve the problem in question.
Step 1: Identify what the question is asking.
This particular question is asking for the relative maximum of the function.
Step 2: Determine the approach to solve the problem.
I. Graphically plot the function using computer technology or graphing calculator.
Then, find where the graph reaches its peak.
Step 3: For the purpose of this question let's solve using graphing calculator technology.
Graphing the function results in the following graph.

Step 4: Trace the function using the graphing calculator to find the coordinates of the peak.

Step 5: Answer the question.
The relative maximum of the function occurs at ")
Example Question #46 : Interpreting Functions
Given the following function, find the line of symmetry.
=|2x-6|")


This question is testing one's ability to grasp the relationship between a function algebraically, and the image it creates graphically. Problems like these are considered modeling problems because of their application. For example, the intercepts, extreme values, slope, symmetry, and end behavior for these functions mark key relationships between the inputs and the resulting outputs.
For the purpose of Common Core Standards, application of interpreting functions fall within the Cluster B of the function and use of function notation concept (CCSS.MATH.CONTENT.HSF-IF.B).
Knowing the standard and the concept for which it relates to, we can now do the step-by-step process to solve the problem in question.
Step 1: Identify what the question is asking.
This particular question is asking for the axis of symmetry for this particular function.
Step 2: Determine the approach to solve the problem.
I. Graphically plot the function using computer technology or graphing calculator.
Then, find the vertical line that splits the graph into two mirrored images. In other words, find the vertical line that is equal to the 
Step 3: Graph the function and plot the vertical line that is equal to the 

Step 4: Answer the question.
The vertex is located at the point ")

Example Question #41 : Interpreting Functions
Find the axis of symmetry for the following function.
=\frac{1}{x}")


This question is testing one's ability to grasp the relationship between a function algebraically, and the image it creates graphically. Problems like these are considered modeling problems because of their application. For example, the intercepts, extreme values, slope, symmetry, and end behavior for these functions mark key relationships between the inputs and the resulting outputs.
For the purpose of Common Core Standards, application of interpreting functions fall within the Cluster B of the function and use of function notation concept (CCSS.MATH.CONTENT.HSF-IF.B).
Knowing the standard and the concept for which it relates to, we can now do the step-by-step process to solve the problem in question.
Step 1: Identify what the question is asking.
This particular question is asking for the axis of symmetry for this particular function.
Step 2: Determine the approach to solve the problem.
I. Graphically plot the function using computer technology or graphing calculator.
Then, find the vertical line that splits the graph into two mirrored images. In other words, find the vertical line that represents a vertical asymptote and the horizontal line that represents a horizontal asymptotes.
Step 3: Graph the function and plot the vertical line that is equal to the 

Step 4: Answer the question.
The vertical asymptote occurs at 

Example Question #42 : Interpreting Functions
Given the function 

=2x^5-4x^3+12")


This question is testing one's ability to grasp the relationship between a function algebraically, and the image it creates graphically. Problems like these are considered modeling problems because of their application. For example, the intercepts, extreme values, slope, symmetry, and end behavior for these functions mark key relationships between the inputs and the resulting outputs.
For the purpose of Common Core Standards, application of interpreting functions fall within the Cluster B of the function and use of function notation concept (CCSS.MATH.CONTENT.HSF-IF.B).
Knowing the standard and the concept for which it relates to, we can now do the step-by-step process to solve the problem in question.
Step 1: Identify what the question is asking.
This particular question is asking for the 
Step 2: Determine the approach to solve the problem.
I. Graphically plot the function using computer technology or graphing calculator.
Then, find where the graph intersects the 
II. Algebraically, find the intercepts by substituting in zero for 


Step 3: Choose an approach from Step 2 and perform the necessary actions.
For the purpose of this question let's solve using option I.

Looking at the graph above, the function crosses the
Example Question #1 : Graph's Domain: Ccss.Math.Content.Hsf If.B.5
 miles per hour every five minutes for two hours resulting in a maximum speed of 95 miles per hour. If
 ") represents this function, what is the domain of
represents this function, what is the domain of  ?
? 


") .
.For the purpose of Common Core Standards, "relate the domain of a function to its graph and, where applicable, to the quantitative relationship it describes" falls within the Cluster B of "interpret functions that arise in applications in terms of the context" concept (CCSS.MATH.CONTENT.HSF-IF.B.5).
Knowing the standard and the concept for which it relates to, we can now do the step-by-step process to solve the problem in question.
 .
.") and create a graph that could possibly fit.
and create a graph that could possibly fit. is in intervals of "miles per every five minutes" and goes from zero to two hours. Therefore to find the units that the
  -axis will have, convert two hours into minutes and then into intervals of five minutes.

 -axis spans from zero to 95.
 the function reaches a maximum value of,
=95") .
. miles per hour every five minutes for two hours", a linear relationship being time and speed is assumed.
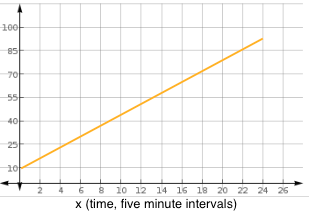
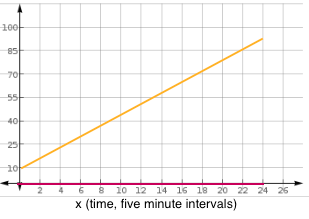
 values that result in a real output that lies in the range of the function. In the above graph the red line indicates the domain of the function. In mathematical terms,
 .
.Example Question #2 : Graph's Domain: Ccss.Math.Content.Hsf If.B.5

A vehicle starts to increase its speed after 25 minutes at a rate of


 .
.For the purpose of Common Core Standards, "relate the domain of a function to its graph and, where applicable, to the quantitative relationship it describes" falls within the Cluster B of "interpret functions that arise in applications in terms of the context" concept (CCSS.MATH.CONTENT.HSF-IF.B.5).
Knowing the standard and the concept for which it relates to, we can now do the step-by-step process to solve the problem in question.
. and create a graph that could possibly fit. is in intervals of "miles per every five minutes" and goes from zero to 125 minutes. Therefore to find the units that the -axis will have, convert 125 minutes into intervals of five minutes. miles per hour every five minutes for 125 minutes", a linear relationship being time and speed is assumed.
values that result in a real output that lies in the range of the function. In mathematical terms, .
.
Certified Tutor

Certified Tutor

All Common Core: High School - Functions Resources

