Common Core: High School - Functions : Graph's Domain: CCSS.Math.Content.HSF-IF.B.5
Study concepts, example questions & explanations for Common Core: High School - Functions


All Common Core: High School - Functions Resources
Example Questions
Example Question #1 : Graph's Domain: Ccss.Math.Content.Hsf If.B.5
 miles per hour every five minutes for two hours resulting in a maximum speed of 95 miles per hour. If
 ") represents this function, what is the domain of
represents this function, what is the domain of  ?
? 


") .
.For the purpose of Common Core Standards, "relate the domain of a function to its graph and, where applicable, to the quantitative relationship it describes" falls within the Cluster B of "interpret functions that arise in applications in terms of the context" concept (CCSS.MATH.CONTENT.HSF-IF.B.5).
Knowing the standard and the concept for which it relates to, we can now do the step-by-step process to solve the problem in question.
 .
.") and create a graph that could possibly fit.
and create a graph that could possibly fit. is in intervals of "miles per every five minutes" and goes from zero to two hours. Therefore to find the units that the
  -axis will have, convert two hours into minutes and then into intervals of five minutes.

 -axis spans from zero to 95.
 the function reaches a maximum value of,
=95") .
. miles per hour every five minutes for two hours", a linear relationship being time and speed is assumed.
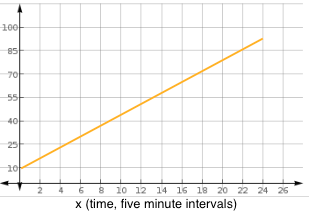
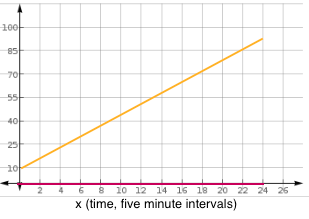
 values that result in a real output that lies in the range of the function. In the above graph the red line indicates the domain of the function. In mathematical terms,
 .
.Example Question #2 : Graph's Domain: Ccss.Math.Content.Hsf If.B.5

A vehicle starts to increase its speed after 25 minutes at a rate of


 .
.For the purpose of Common Core Standards, "relate the domain of a function to its graph and, where applicable, to the quantitative relationship it describes" falls within the Cluster B of "interpret functions that arise in applications in terms of the context" concept (CCSS.MATH.CONTENT.HSF-IF.B.5).
Knowing the standard and the concept for which it relates to, we can now do the step-by-step process to solve the problem in question.
. and create a graph that could possibly fit. is in intervals of "miles per every five minutes" and goes from zero to 125 minutes. Therefore to find the units that the -axis will have, convert 125 minutes into intervals of five minutes. miles per hour every five minutes for 125 minutes", a linear relationship being time and speed is assumed.
values that result in a real output that lies in the range of the function. In mathematical terms, .
.Example Question #3 : Graph's Domain: Ccss.Math.Content.Hsf If.B.5
A vehicle increases its speed by


 .
.For the purpose of Common Core Standards, "relate the domain of a function to its graph and, where applicable, to the quantitative relationship it describes" falls within the Cluster B of "interpret functions that arise in applications in terms of the context" concept (CCSS.MATH.CONTENT.HSF-IF.B.5).
Knowing the standard and the concept for which it relates to, we can now do the step-by-step process to solve the problem in question.
. and create a graph that could possibly fit. is in intervals of "miles per every five minutes" and goes from zero to 45 minutes. Therefore to find the units that the -axis will have, convert 45 minutes into intervals of five minutes. -axis spans from zero to 33. the function reaches a maximum value of,
=33") . miles per hour every five minutes for 45 minutes", a linear relationship being time and speed is assumed.
. miles per hour every five minutes for 45 minutes", a linear relationship being time and speed is assumed.
values that result in a real output that lies in the range of the function. In mathematical terms, .
.Example Question #4 : Graph's Domain: Ccss.Math.Content.Hsf If.B.5
A vehicle increases its speed by


 .
.For the purpose of Common Core Standards, "relate the domain of a function to its graph and, where applicable, to the quantitative relationship it describes" falls within the Cluster B of "interpret functions that arise in applications in terms of the context" concept (CCSS.MATH.CONTENT.HSF-IF.B.5).
Knowing the standard and the concept for which it relates to, we can now do the step-by-step process to solve the problem in question.
. and create a graph that could possibly fit. is in intervals of "miles per every two minutes" and goes from zero to 20 minutes. Therefore to find the units that the -axis will have, convert 20 minutes into intervals of two minutes. -axis spans from zero to 25. the function reaches a maximum value of,
=25") . miles per hour every two minutes for 20 minutes", a linear relationship being time and speed is assumed.
. miles per hour every two minutes for 20 minutes", a linear relationship being time and speed is assumed.
values that result in a real output that lies in the range of the function. In mathematical terms, .
.Example Question #5 : Graph's Domain: Ccss.Math.Content.Hsf If.B.5
A vehicle decreases its speed by


 .
.For the purpose of Common Core Standards, "relate the domain of a function to its graph and, where applicable, to the quantitative relationship it describes" falls within the Cluster B of "interpret functions that arise in applications in terms of the context" concept (CCSS.MATH.CONTENT.HSF-IF.B.5).
Knowing the standard and the concept for which it relates to, we can now do the step-by-step process to solve the problem in question.
. and create a graph that could possibly fit. miles per hour every three minutes until the vehicle is at rest", a linear relationship being time and speed is assumed.
values that result in a real output that lies in the range of the function. In mathematical terms, .
.Example Question #6 : Graph's Domain: Ccss.Math.Content.Hsf If.B.5
A vehicle decreases its speed by


 .
.For the purpose of Common Core Standards, "relate the domain of a function to its graph and, where applicable, to the quantitative relationship it describes" falls within the Cluster B of "interpret functions that arise in applications in terms of the context" concept (CCSS.MATH.CONTENT.HSF-IF.B.5).
Knowing the standard and the concept for which it relates to, we can now do the step-by-step process to solve the problem in question.
. and create a graph that could possibly fit. is in intervals of "miles per every five minutes" and goes from zero to 45 minutes. Therefore to find the units that the -axis will have, convert 45 minutes into intervals of five minutes. -axis spans from 25 to a higher number . miles per hour every five minutes for 45 minutes", a linear relationship being time and speed is assumed.
values that result in a real output that lies in the range of the function. In mathematical terms, .
.Example Question #7 : Graph's Domain: Ccss.Math.Content.Hsf If.B.5

A vehicle starts to increase its speed after 10 minutes at a rate of


 .
.For the purpose of Common Core Standards, "relate the domain of a function to its graph and, where applicable, to the quantitative relationship it describes" falls within the Cluster B of "interpret functions that arise in applications in terms of the context" concept (CCSS.MATH.CONTENT.HSF-IF.B.5).
Knowing the standard and the concept for which it relates to, we can now do the step-by-step process to solve the problem in question.
. and create a graph that could possibly fit. is in intervals of "miles per every five minutes" and goes from zero to 80 minutes. Therefore to find the units that the -axis will have, convert 80 into intervals of five minutes. -axis spans from zero to 12. the function reaches a maximum value of,
=12") . miles per hour every five minutes for 80 minutes", a linear relationship being time and speed is assumed. values that result in a real output that lies in the range of the function. In mathematical terms,
. miles per hour every five minutes for 80 minutes", a linear relationship being time and speed is assumed. values that result in a real output that lies in the range of the function. In mathematical terms, .
.Example Question #8 : Graph's Domain: Ccss.Math.Content.Hsf If.B.5

A vehicle starts to increase its speed after 50 minutes at a rate of


 .
.For the purpose of Common Core Standards, "relate the domain of a function to its graph and, where applicable, to the quantitative relationship it describes" falls within the Cluster B of "interpret functions that arise in applications in terms of the context" concept (CCSS.MATH.CONTENT.HSF-IF.B.5).
Knowing the standard and the concept for which it relates to, we can now do the step-by-step process to solve the problem in question.
. and create a graph that could possibly fit. is in intervals of "miles per every five minutes" and goes from zero to 175 minutes. Therefore to find the units that the -axis will have, convert 175 minutes into intervals of five minutes. -axis spans from zero to 45. the function reaches a maximum value of,
=45") . miles per hour every five minutes for 175 minutes resulting in a maximum speed of 45 miles per hour", a linear relationship being time and speed is assumed.
. miles per hour every five minutes for 175 minutes resulting in a maximum speed of 45 miles per hour", a linear relationship being time and speed is assumed.
values that result in a real output that lies in the range of the function. In mathematical terms, .
.Example Question #9 : Graph's Domain: Ccss.Math.Content.Hsf If.B.5

A vehicle decrease its speed at a rate of


 .
.For the purpose of Common Core Standards, "relate the domain of a function to its graph and, where applicable, to the quantitative relationship it describes" falls within the Cluster B of "interpret functions that arise in applications in terms of the context" concept (CCSS.MATH.CONTENT.HSF-IF.B.5).
Knowing the standard and the concept for which it relates to, we can now do the step-by-step process to solve the problem in question.
. and create a graph that could possibly fit. is in intervals of "miles per every five minutes" and goes from zero to 90 minutes. Therefore to find the units that the -axis will have, convert 90 minutes into intervals of five minutes. -axis spans from zero to 5. the function reaches a maximum value of,
=5") . miles per hour every five minutes for 90 minutes", a linear relationship being time and speed is assumed.
. miles per hour every five minutes for 90 minutes", a linear relationship being time and speed is assumed.
values that result in a real output that lies in the range of the function. In mathematical terms, .
.Example Question #51 : High School: Functions

A vehicle decrease its speed at a rate of


 .
.For the purpose of Common Core Standards, "relate the domain of a function to its graph and, where applicable, to the quantitative relationship it describes" falls within the Cluster B of "interpret functions that arise in applications in terms of the context" concept (CCSS.MATH.CONTENT.HSF-IF.B.5).
Knowing the standard and the concept for which it relates to, we can now do the step-by-step process to solve the problem in question.
. and create a graph that could possibly fit. is in intervals of "miles per every five minutes" and goes from zero to 225 minutes. Therefore to find the units that the -axis will have, convert 225 minutes into intervals of five minutes. miles per hour every five minutes for 90 minutes", a linear relationship being time and speed is assumed.
values that result in a real output that lies in the range of the function. In mathematical terms, .
.

Certified Tutor

Certified Tutor

All Common Core: High School - Functions Resources

