Algebra II : Graphing Hyperbolic Inequalities
Study concepts, example questions & explanations for Algebra II


All Algebra II Resources
Example Questions
Example Question #1 : Graphing Hyperbolic Inequalities
Which inequality does this graph represent? 


The hyperbola in the question's graph is 
This could be discerned because it subtracts 


Test a point to tell which inequality is being used in the graph.
The point ")


Example Question #140 : Quadratic Functions
Which inequality does this graph represent? 


The hyperbola in the graph has y-intercepts rather than x-intercepts, so the equation must be in the form 
The y-intercepts are at 1 and -1, so the correct equation will have just 

The answer not must either be,


To see which, test a point in the shaded area.
For example, ")


Example Question #21 : Quadratic Inequalities
Which inequality does this graph represent?
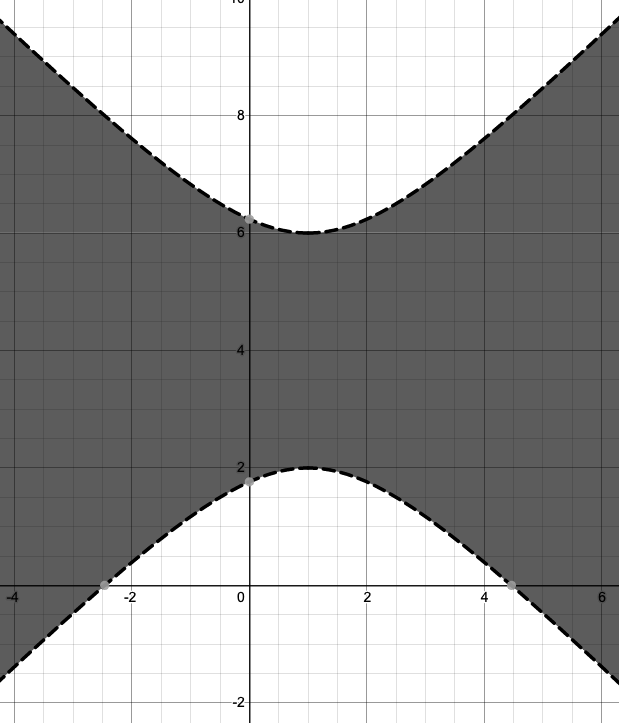
^2]/4 - [(y-4)^2]/4 > 1")
^2]/4 - [(x-1)^2]/4 < 1")
^2]/4 - [(x-1)^2]/4 \leq 1")
^2]/4 - [(y-4)^2]/4 \geq 1")
The equation for a horizontal hyperbola is ^2]/(a^2) - [(y-v)^2]/(b^2) = 1")
^2]/(b^2) - [(x-h)^2]/(a^2) = 1")
")


Example Question #22 : Quadratic Inequalities
Which of the following inequalities is not hyperbolic?
^2]/9 + [(y-2)^2]/100 \leq 1")
^2]/16 - [(y+2)^2]/36 > 3")
^2]/4 - [(x-1)^2]/4 < 7")
^2]/49 - [(x-1)^2]/4 \geq 7")
The equation for a horizontal hyperbola is^2]/(a^2) - [(y-v)^2]/(b^2) = 1")
^2]/(b^2) - [(x-h)^2]/(a^2) = 1")
^2]/16 - [(y+2)^2]/36 > 3")
^2]/4 - [(x-1)^2]/4 < 7")
^2]/49 - [(x-1)^2]/4 \geq 7")
^2]/9 + [(y-2)^2]/100 \leq 1")
^2]/(a^2) + [(y-k)^2]/(b^2) = 1")
Example Question #541 : Functions And Graphs
Which of the following inequalities is not hyperbolic?
^2]/4 - 2[(y-3)^2]/16 \leq 1")
^2]/25 - [(y+4)^2]/4 <1")
]/4 - [(x-1)^2]/25 > 1")
^2]/16 - [(x-2)^2]/25 \geq 1")
The equation for a horizontal hyperbola is ^2]/(a^2) - [(y-v)^2]/(b^2) = 1")
^2]/(b^2) - [(x-h)^2]/(a^2) = 1")
^2]/4 - 2[(y-3)^2]/16 \leq 1")
^2]/16 - [(x-2)^2]/25 >= 1")
^2]/4 - 2[(y-3)^2]/16 \leq 1")
^2]/16 - [(x-2)^2]/25 \geq 1")
]/4 - [(x-1)^2]/25 > 1")
Example Question #24 : Quadratic Inequalities
Which inequality does this graph represent?
^2]/1 - [(y+1)^2]/9 \leq 1")
^2]/1 - [(y-1)^2]/9 > 1")
^2]/1 - [(y+1)^2]/9 < 1")
^2]/1 - [(y-1)^2]/9 \geq 1")
The equation for a horizontal hyperbola is ^2]/(a^2) - [(y-v)^2]/(b^2) = 1")
^2]/(b^2) - [(x-h)^2]/(a^2) = 1")


Example Question #25 : Quadratic Inequalities
Which inequality does this graph represent?
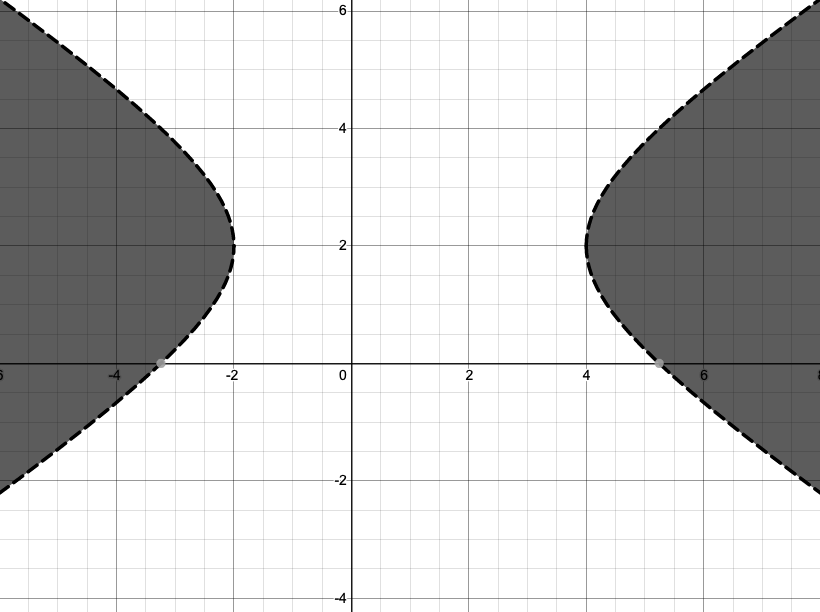
^2]/9 - [(y-2)^2]/4 < 1")
^2]/4 - [(x-1)^2]/9 < 1")
^2]/4 - [(x-1)^2]/9 > 1")
^2]/9 - [(y-2)^2]/4 > 1")
The equation for a horizontal hyperbola is ^2]/(a^2) - [(y-v)^2]/(b^2) = 1")
^2]/(b^2) - [(x-h)^2]/(a^2) = 1")
Example Question #1 : Graphing Hyperbolic Inequalities
Which inequality does this graph represent?
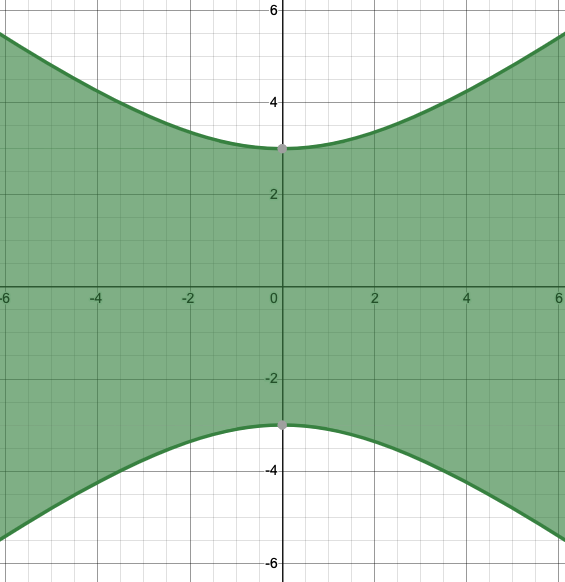
/9 - (x^2)/16 < 1")
/16 - (y^2)/9 > 1")
/9 - (x^2)/16 \leq 1")
/16 - (y^2)/9 \geq 1")
The equation for a horizontal hyperbola is ^2]/(a^2) - [(y-v)^2]/(b^2) = 1")
^2]/(b^2) - [(x-h)^2]/(a^2) = 1")


Example Question #2 : Graphing Hyperbolic Inequalities
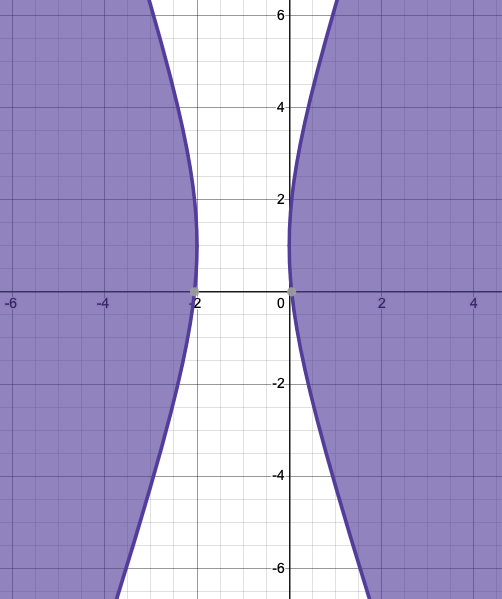
Which graph represents the inequality /16 - (y^2)/1 < 1")
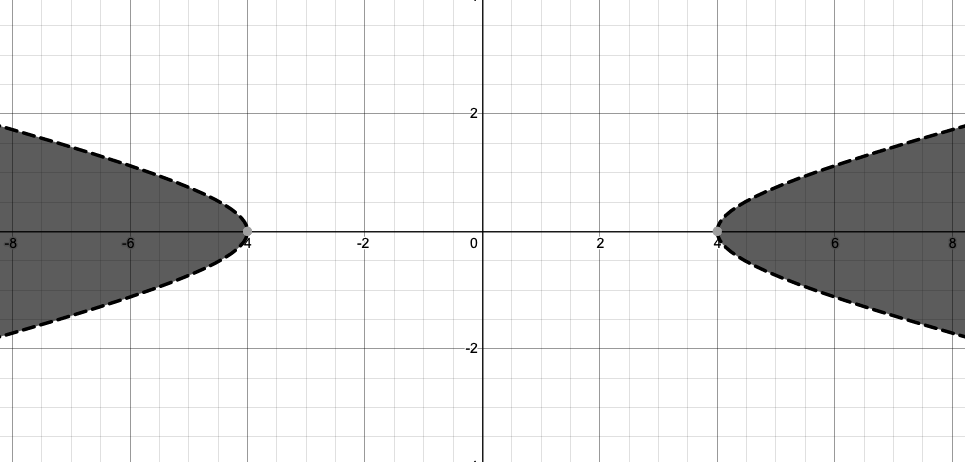

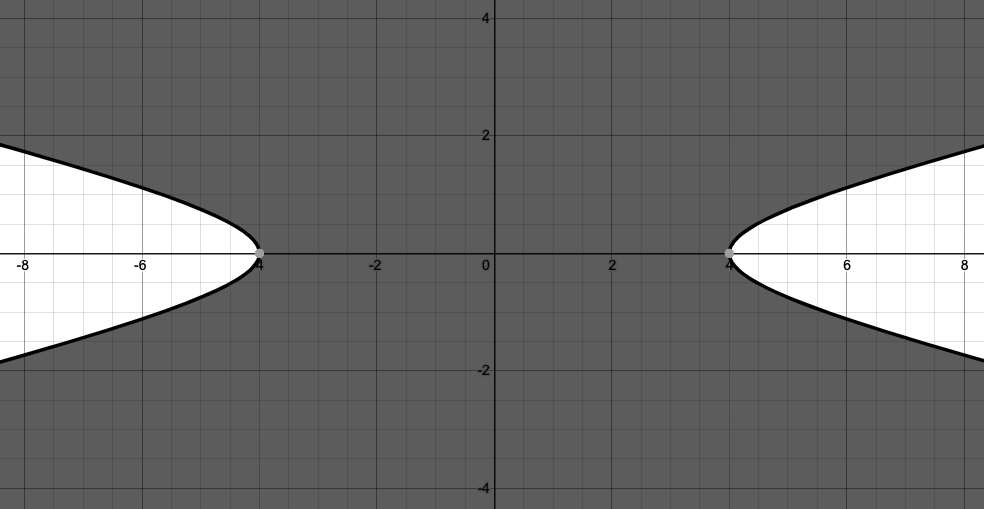

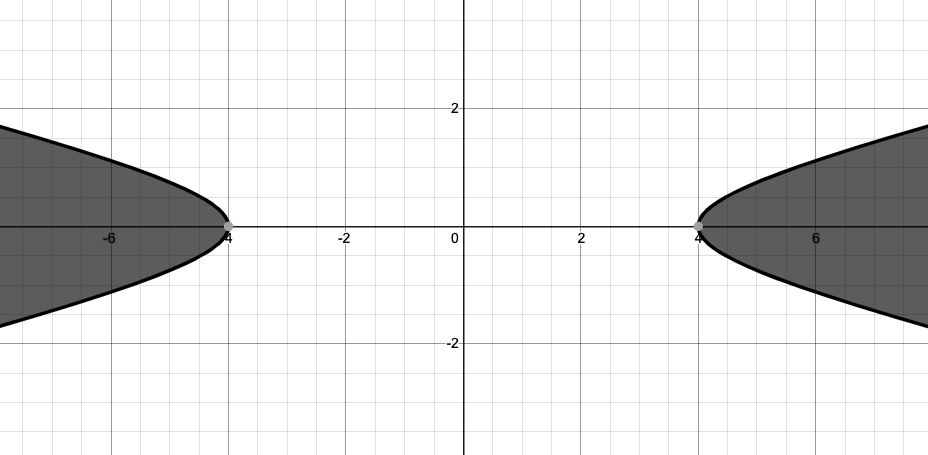

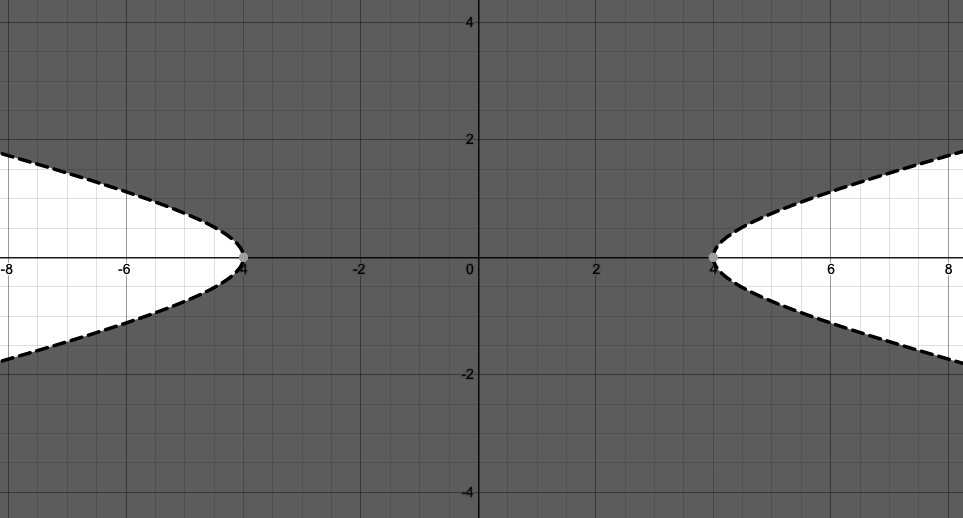

The equation for a horizontal hyperbola is^2]/(a^2) - [(y-v)^2]/(b^2) = 1")
^2]/(b^2) - [(x-h)^2]/(a^2) = 1")


Example Question #3 : Graphing Hyperbolic Inequalities
Which graph represents the inequality ^2]/1 - [(x+2)^2]/9 \geq 1")
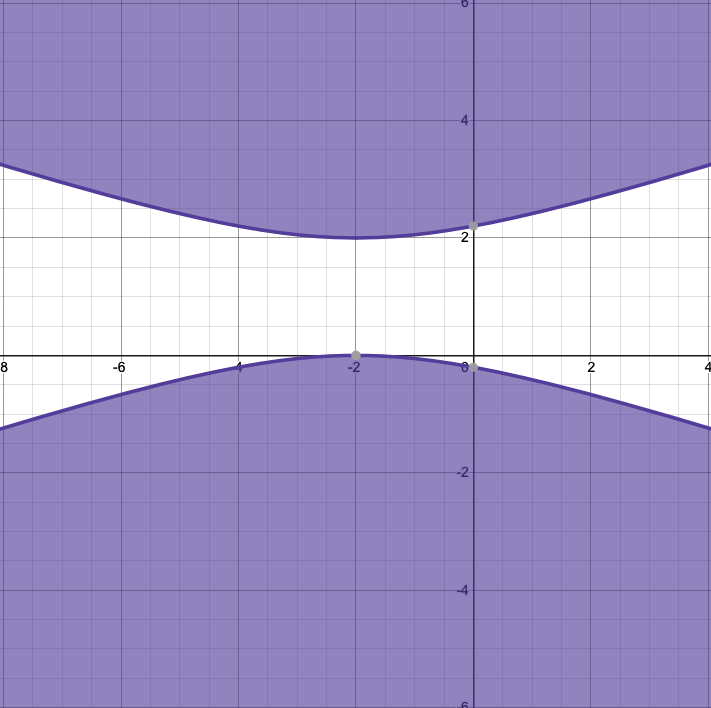

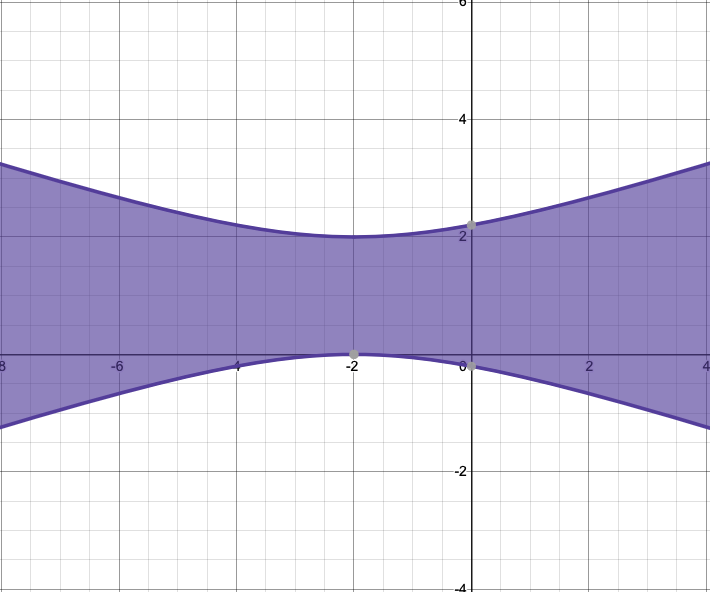

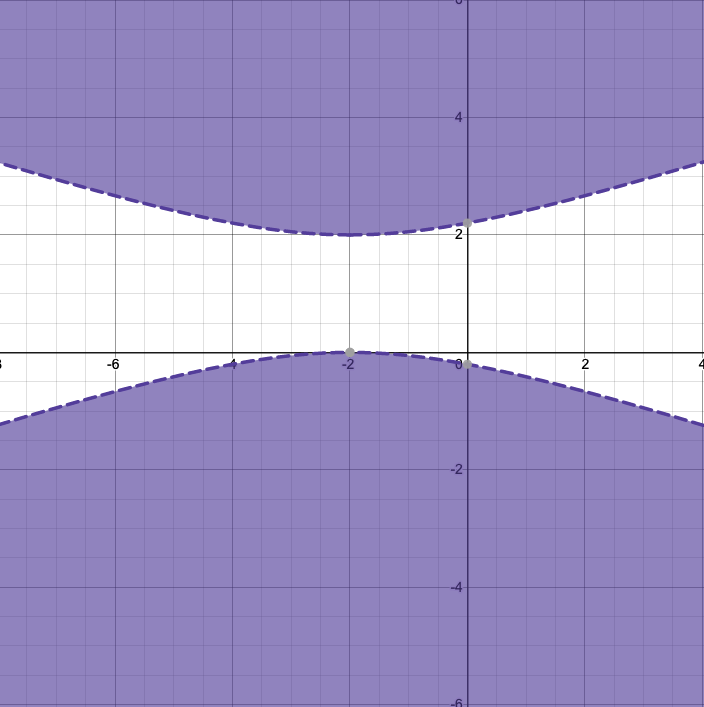

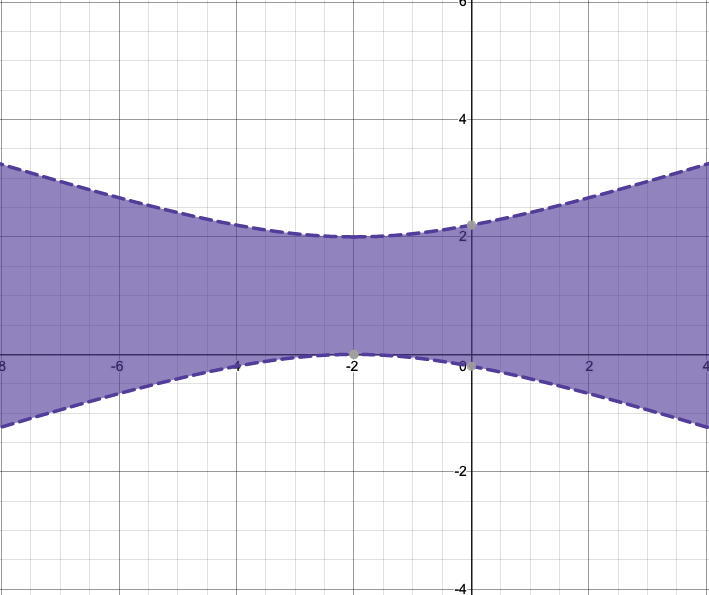

The equation for a horizontal hyperbola is ^2]/(a^2) - [(y-v)^2]/(b^2) = 1")
^2]/(b^2) - [(x-h)^2]/(a^2) = 1")


All Algebra II Resources

