Algebra 1 : Functions and Lines
Study concepts, example questions & explanations for Algebra 1


All Algebra 1 Resources
Example Questions
Example Question #1 : Functions And Graphs
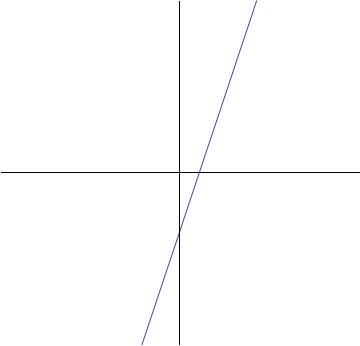
Which graph depicts a function?


A function may only have one y-value for each x-value.
The vertical line test can be used to identify the function. If at any point on the graph, a straight vertical line intersects the curve at more than one point, the curve is not a function.
Example Question #3311 : Algebra 1
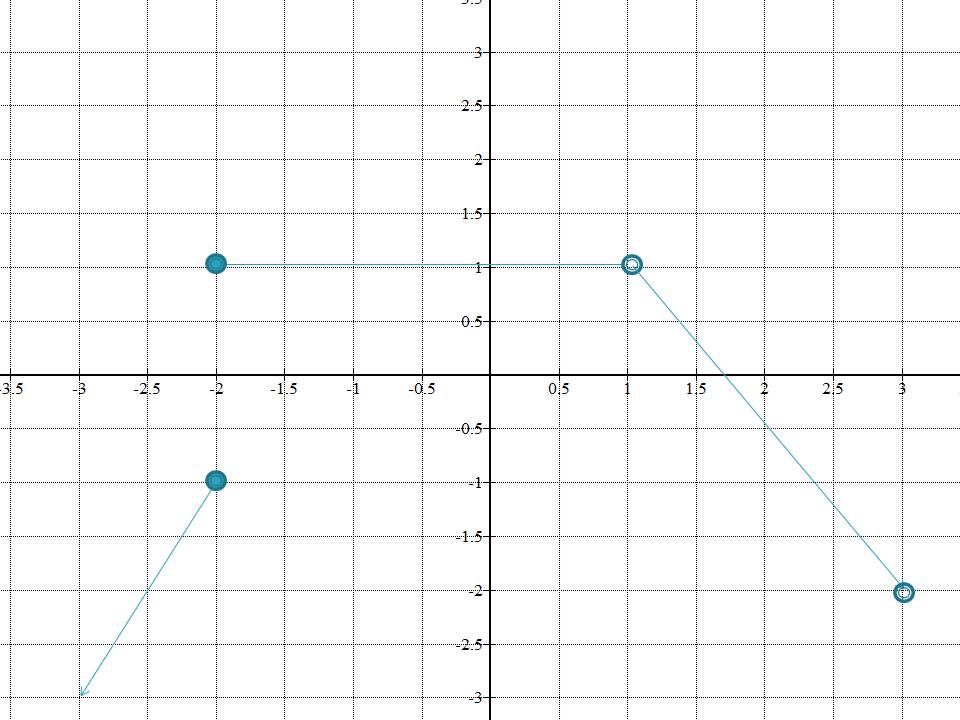
The graph below is the graph of a piece-wise function in some interval. Identify, in interval notation, the decreasing interval.
")
\cup \left ( 1,3\right]")
")
\cup (1,3)")
")
As is clear from the graph, in the interval between 


")


")
Example Question #1 : Graphing Polynomial Functions
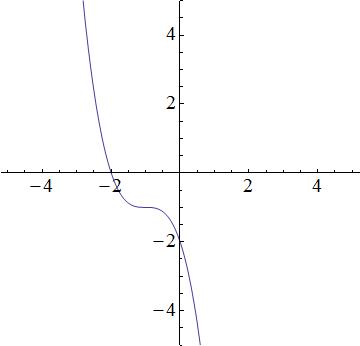
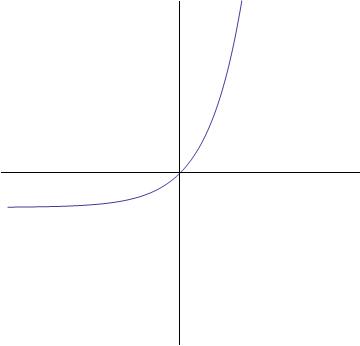
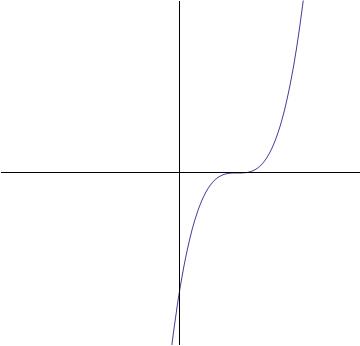
Which equation best represents the following graph?
=-x-1")
=-(x+1)^3-1")
=e^{2x-1}+\frac{1}{9}")
None of these
=-(x+1)^2-1")
We have the following answer choices.
=-(x + 1)^3 - 1")
=-(x + 1)^2 - 1")
=-x - 1")
=e^{2x-1}+\frac{1}{9}")
The first equation is a cubic function, which produces a function similar to the graph. The second equation is quadratic and thus, a parabola. The graph does not look like a prabola, so the 2nd equation will be incorrect. The third equation describes a line, but the graph is not linear; the third equation is incorrect. The fourth equation is incorrect because it is an exponential, and the graph is not an exponential. So that leaves the first equation as the best possible choice.
Example Question #31 : Functions And Lines
What is the horizontal asymptote of the graph of the equation 


The asymptote of this equation can be found by observing that 


So the value that 


Example Question #1 : Solving And Graphing Exponential Equations
What is/are the asymptote(s) of the graph of the function
 = 5e^{x-2}-2")


An exponential equation of the form  = ae^{x-h} +k")


Example Question #31 : Functions And Lines


=0\\ x=1.\\\textup{ Remember }e^0=1 \textup{, so when plugging } x=1 \textup{ in the initial equation, you obtain }\\ e^{1-1}-1=e^0-1=1-1=0.")
Example Question #1 : How To Graph A Two Step Inequality
Which graph depicts the following inequality?

No real solution.
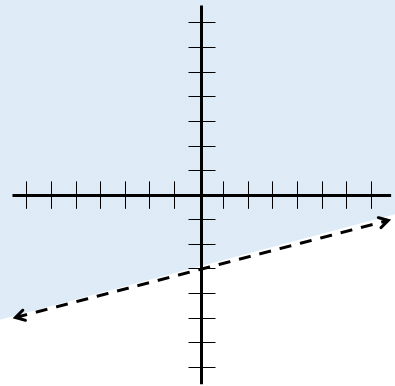
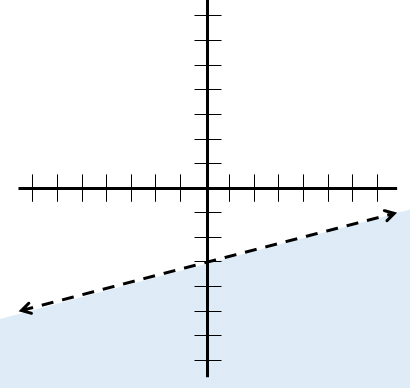
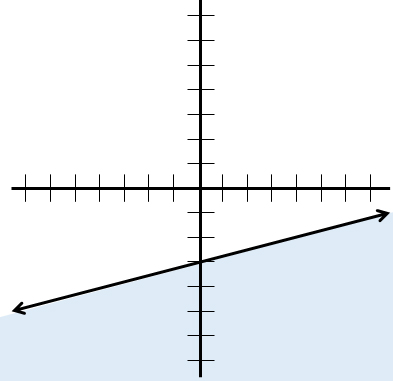
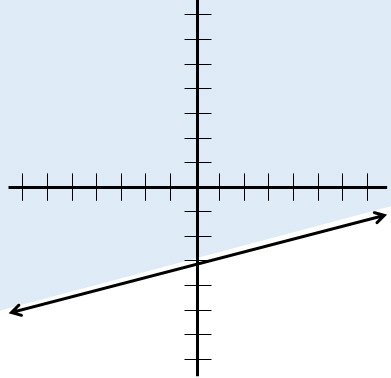
Let's put the inequality in slope-intercept form to make it easier to graph:


The inequality is now in slope-intercept form. Graph a line with slope 

Because the inequality sign is greater than or equal to, a solid line should be used.
Next, test a point. The origin ")
-3\geq0")
The statement is false. Therefore, the section of the graph that does not contain the origin should be shaded.
Example Question #2 : Quadratic Functions
What is the minimum possible value of the expression below?


The expression has no minimum value.


We can determine the lowest possible value of the expression by finding the 


-10")
-3* 1-10")
^{2}-13")
The vertex of the parabola ^{2}-13")
")
The parabola is concave upward (its quadratic coefficient is positive), so 

Example Question #1 : How To Graph A Quadratic Function
What is the vertex of the function =2(x-4)^2+7")
")
")
")
")
The equation of a parabola can be written in vertex form: =a(x-h)^2+k")
The point ")


=2(x-4)^2+7")
In this example, 

=(4,7)")
Example Question #2 : Graphing Polynomial Functions
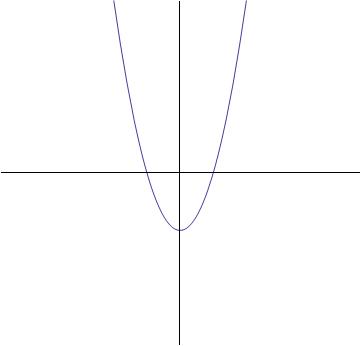
Which of the graphs best represents the following function?
=\frac{9}{10}x^2-7x+2")
None of these
=\frac{9}{10}x^2-7x+2")
The highest exponent of the variable term is two (
The graph below will be the answer, as it shows a parabolic curve.


All Algebra 1 Resources

