Advanced Geometry : How to graph a function
Study concepts, example questions & explanations for Advanced Geometry


All Advanced Geometry Resources
Example Questions
Example Question #2 : Graphing
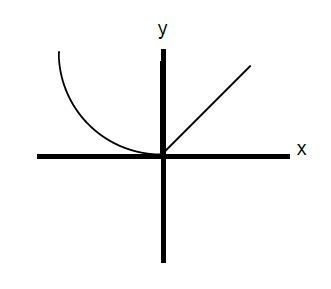
The figure above shows the graph of y = f(x). Which of the following is the graph of y = |f(x)|?
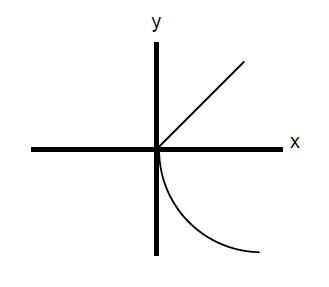
One of the properties of taking an absolute value of a function is that the values are all made positive. The values themselves do not change; only their signs do. In this graph, none of the y-values are negative, so none of them would change. Thus the two graphs should be identical.
Example Question #3 : Graphing
Below is the graph of the function ")
Which of the following could be the equation for ")
=\left | 2x-6 \right |")
=\left | x-1 \right |-2")
=x^2-4x+3")
=\left | x^2-4x \right |-3")
=\left | 2x-2 \right |-4")
First, because the graph consists of pieces that are straight lines, the function must include an absolute value, whose functions usually have a distinctive "V" shape. Thus, we can eliminate f(x) = x2 – 4x + 3 from our choices. Furthermore, functions with x2 terms are curved parabolas, and do not have straight line segments. This means that f(x) = |x2 – 4x| – 3 is not the correct choice.
Next, let's examine f(x) = |2x – 6|. Because this function consists of an abolute value by itself, its graph will not have any negative values. An absolute value by itself will only yield non-negative numbers. Therefore, because the graph dips below the x-axis (which means f(x) has negative values), f(x) = |2x – 6| cannot be the correct answer.
Next, we can analyze f(x) = |x – 1| – 2. Let's allow x to equal 1 and see what value we would obtain from f(1).
f(1) = | 1 – 1 | – 2 = 0 – 2 = –2
However, the graph above shows that f(1) = –4. As a result, f(x) = |x – 1| – 2 cannot be the correct equation for the function.
By process of elimination, the answer must be f(x) = |2x – 2| – 4. We can verify this by plugging in several values of x into this equation. For example f(1) = |2 – 2| – 4 = –4, which corresponds to the point (1, –4) on the graph above. Likewise, if we plug 3 or –1 into the equation f(x) = |2x – 2| – 4, we obtain zero, meaning that the graph should cross the x-axis at 3 and –1. According to the graph above, this is exactly what happens.
The answer is f(x) = |2x – 2| – 4.
Example Question #1 : Graphing
Which of the following could be a value of 


The graph is a down-opening parabola with a maximum of 
Example Question #5 : How To Graph A Function
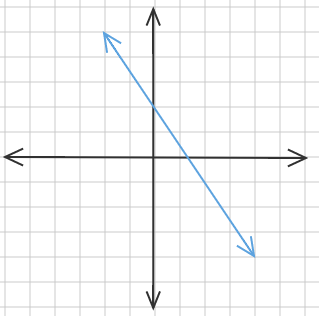
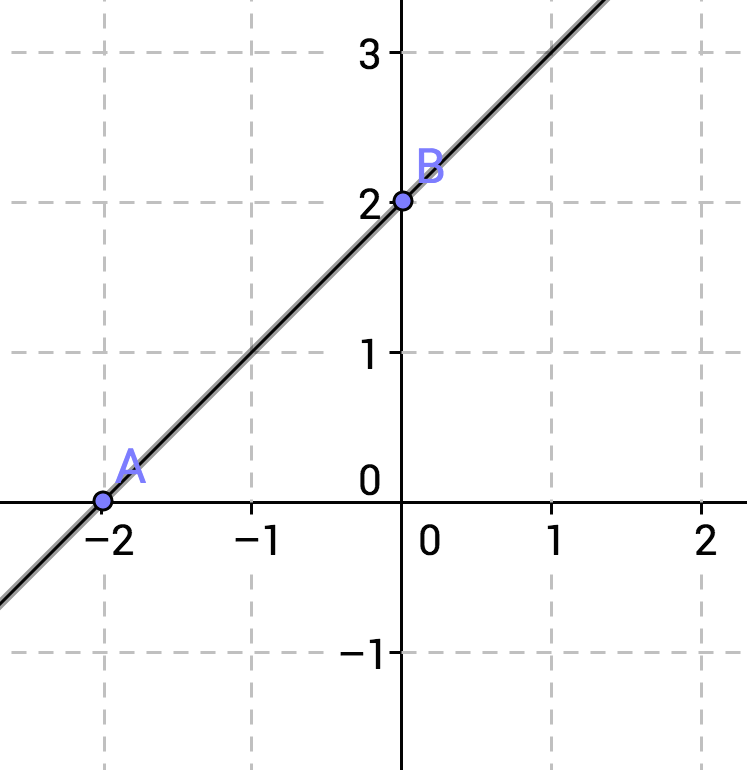
What is the equation for the line pictured above?


A line has the equation


The 
")

The slope can be found by selecting two points, for example, the y-intercept and the next point over that crosses an even point, for example, ")
Now applying the slope formula,

which yields 
Therefore the equation of the line becomes:

Example Question #6 : How To Graph A Function
=2x+4")
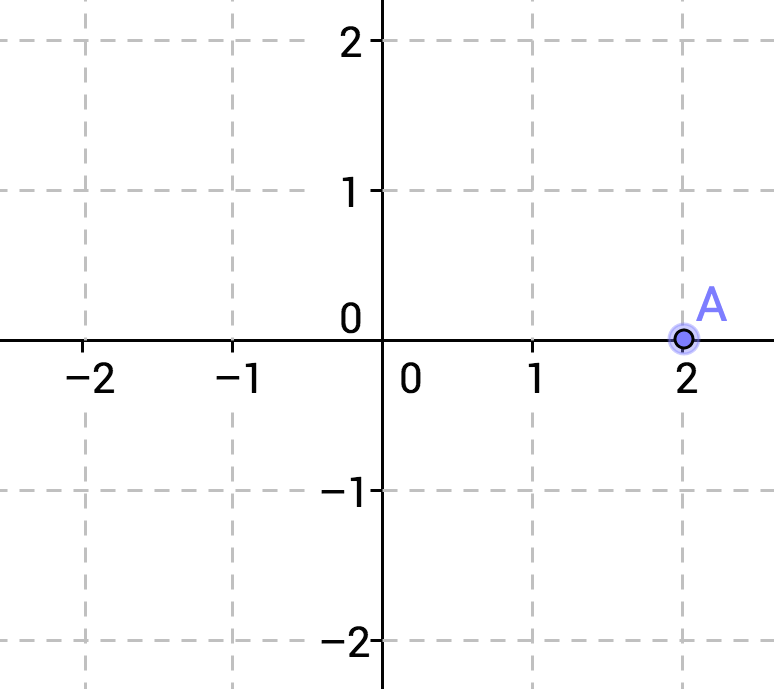
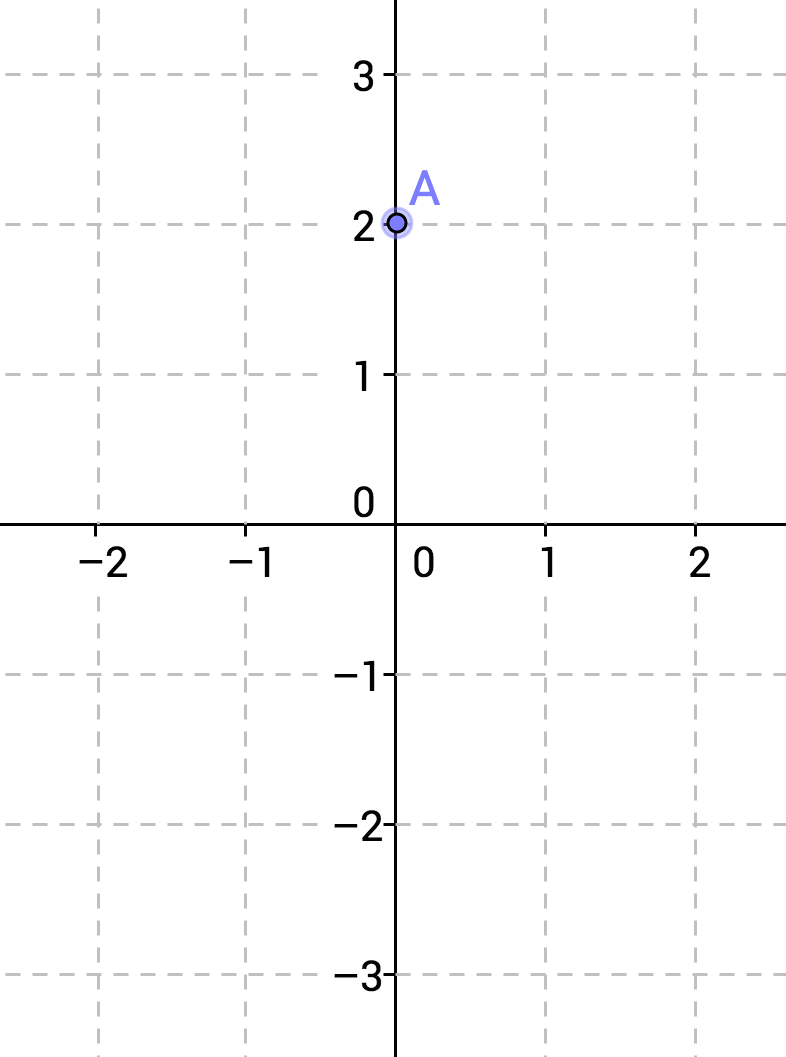
Which of the following graphs represents the y-intercept of this function?
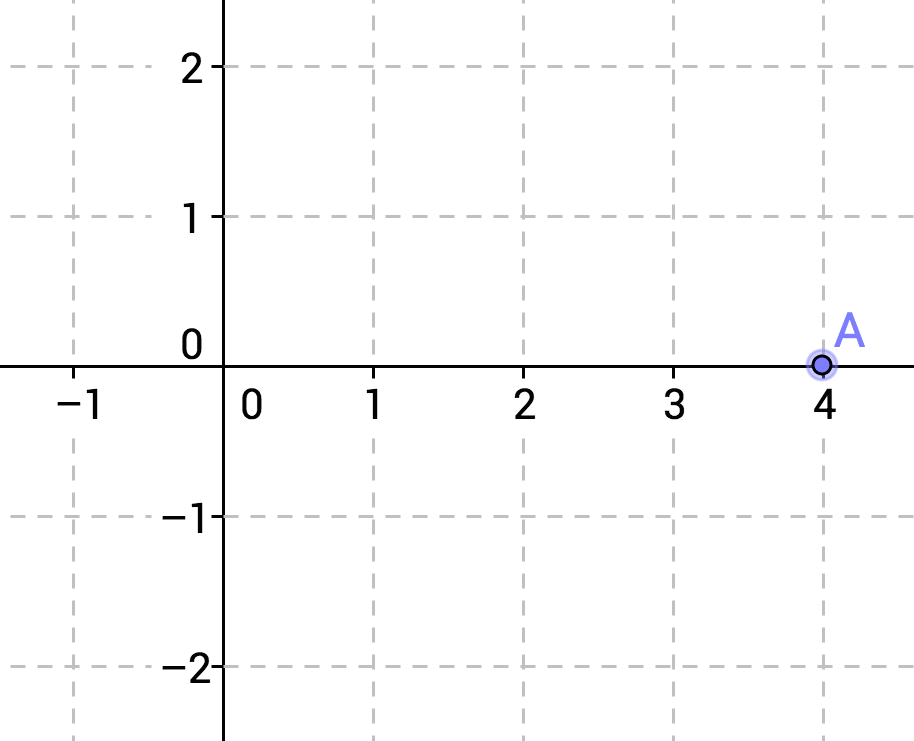
Graphically, the y-intercept is the point at which the graph touches the y-axis. Algebraically, it is the value of 

Here, we are given the function =2x+4")


+4")

So the y-intercept is at ")
Example Question #2 : Graphing
=2x+4")
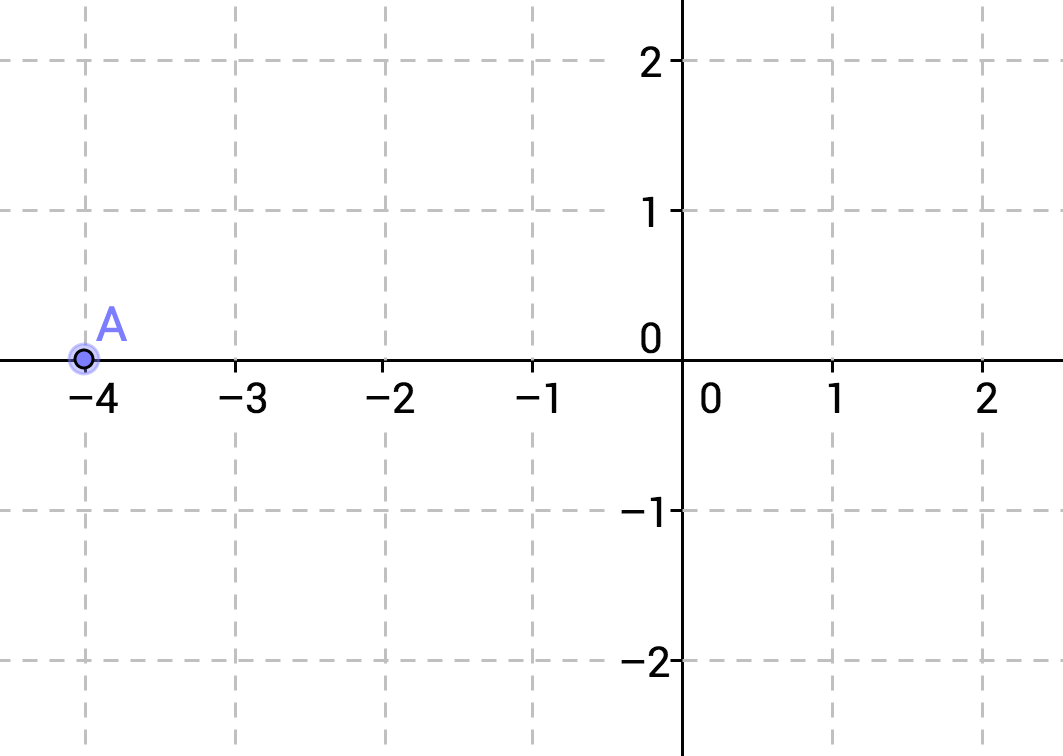
Which of the following graphs represents the x-intercept of this function?
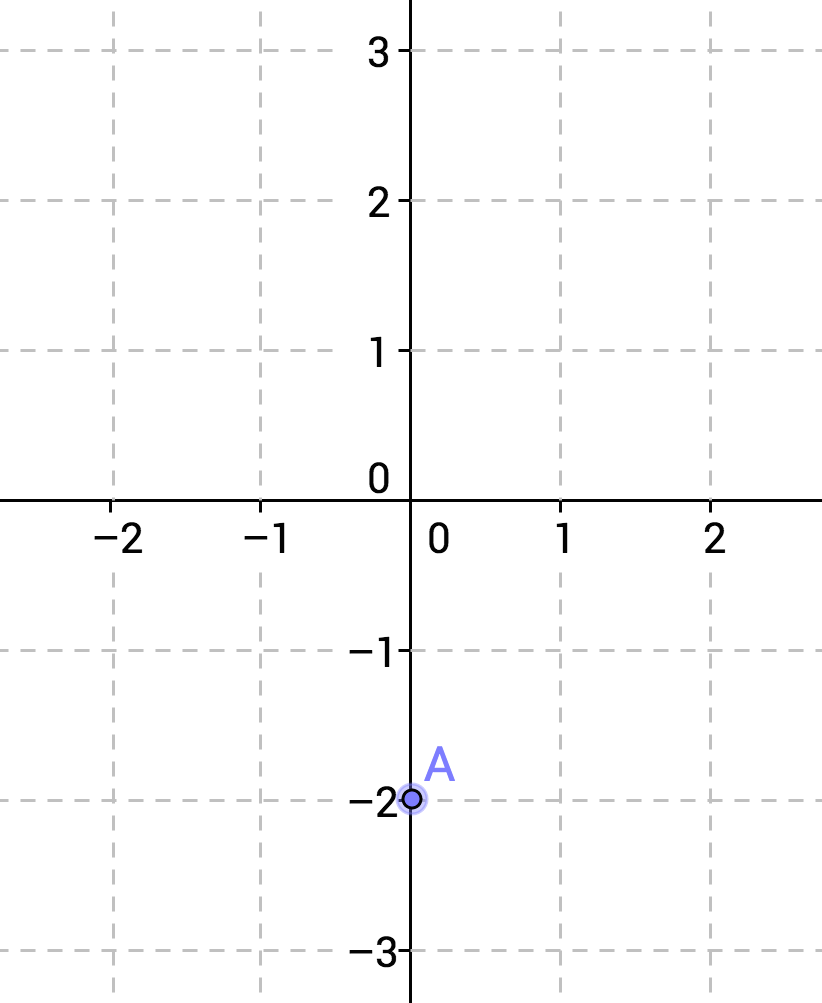
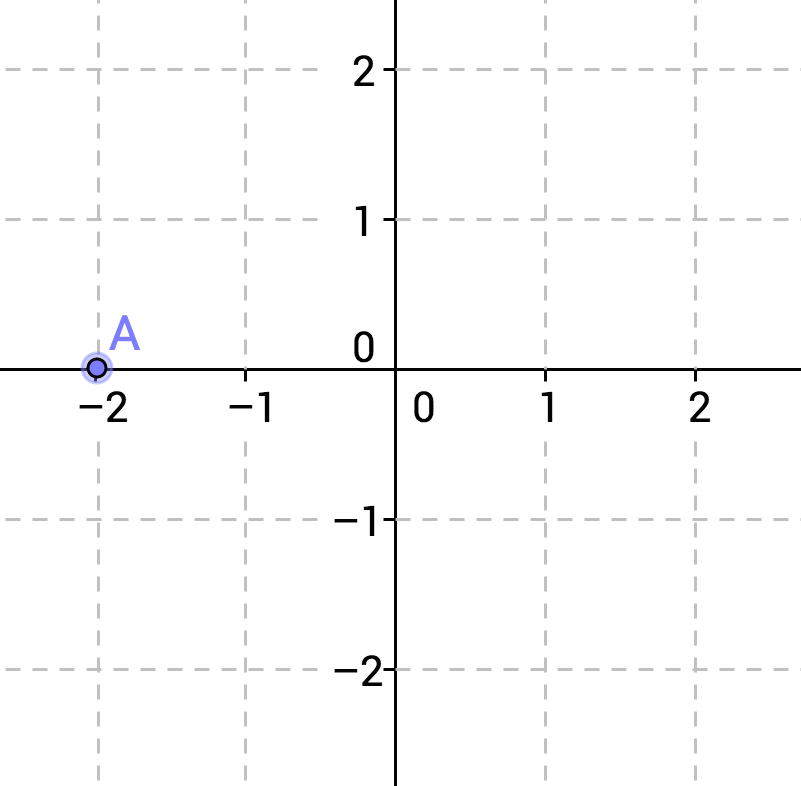
Graphically, the x-intercept is the point at which the graph touches the x-axis. Algebraically, it is the value of 

Here, we are given the function =2x+4")


So the x-intercept is at ")
Example Question #7 : How To Graph A Function
Which of the following represents =\frac{1}{2}x-2")
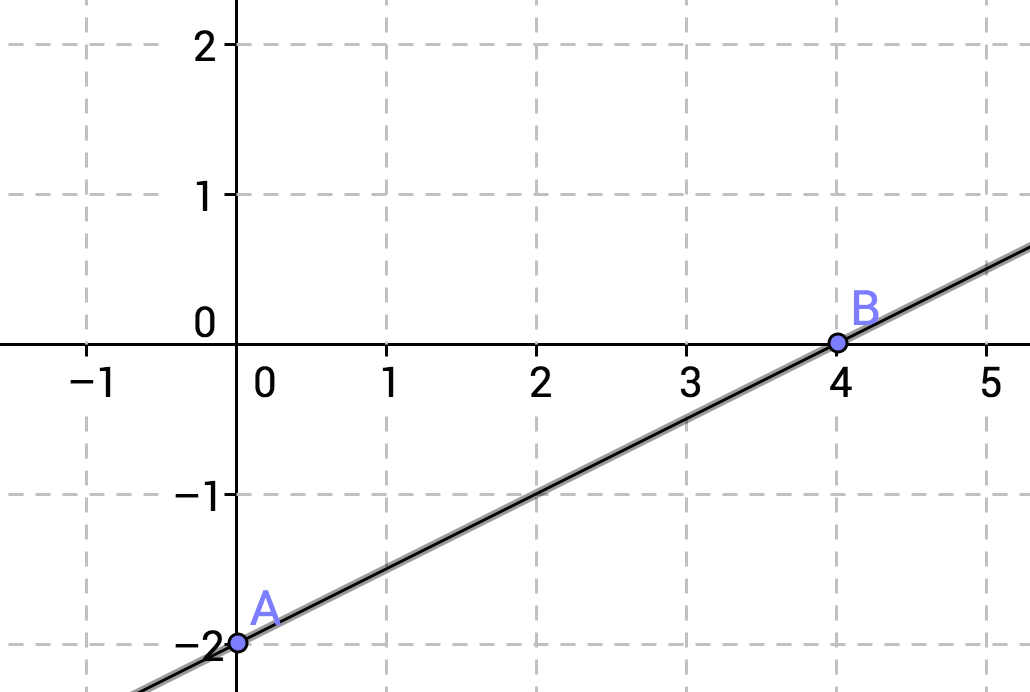
A line is defined by any two points on the line. It is frequently simplest to calculate two points by substituting zero for x and solving for y, and by substituting zero for y and solving for x.
=\frac{1}{2}x-2")
Let 
-2")

So our first set of points (which is also the y-intercept) is
")
Let 


So our second set of points (which is also the x-intercept) is )")
Example Question #1 : How To Graph A Function
Suppose 
To obtain the graph of  + c")
")

To the left
To the right
Upwards
Up and right
Downwards
Upwards
There are four shifts of the graph y = f(x):
y = f(x) + c shifts the graph c units upwards.
y = f(x) – c shifts the graph c units downwards.
y = f(x + c) shifts the graph c units to the left.
y = f(x – c) shifts the graph c units to the right.
Example Question #11 : How To Graph A Function
Which graph accurately represents the following function:


The first step in determining which graph is correct is finding the origin of the function. If both x and y are equal to 0, the coordinates of the origin would be ")

Example Question #12 : How To Graph A Function
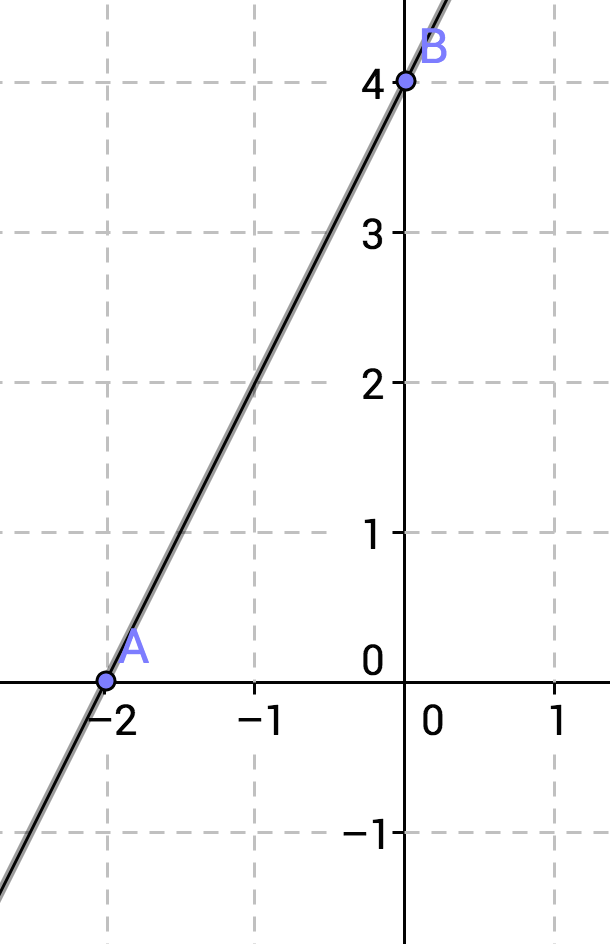
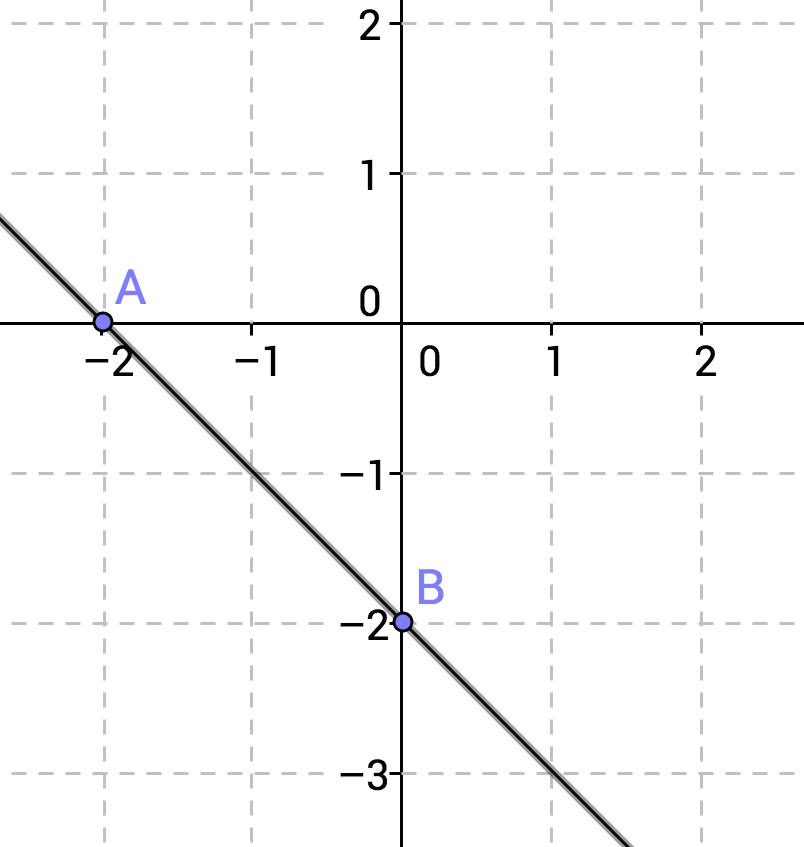
Which of the following graphs represents
Which of the following graphs represents the function 


The easiest way to determine which graph belongs to the equation is to find the x-intercept, the slope, and if necessary the y-intercept as well.
This equation is written in 
Therefore we know that the slope equals 
")
The x-intercept can be found by substituting 0 for y and solving the equation.
The x-intercept is ")
The only graph that meets these standards is

Certified Tutor

Certified Tutor

All Advanced Geometry Resources

