ACT Science : How to find synthesis of data in biology
Study concepts, example questions & explanations for ACT Science


All ACT Science Resources
Example Questions
Example Question #41 : How To Find Synthesis Of Data In Biology
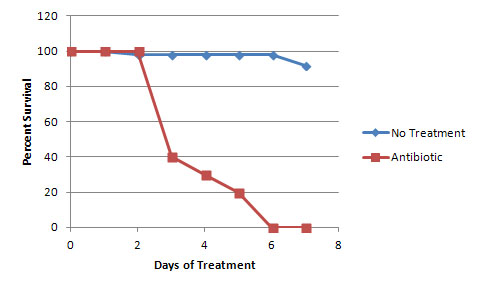
Consider the graph. A company is attempting to develop a new antibiotic to treat Staph infections. A petri dish of bacterial colonies are grown on LB plates with or without an antibiotic for 7 days. The percent survival of the bacterial colonies is plotted. Based on the data, a patient should take the antibiotic for a minimum of how many days?
3
2
6
5
6
After 5 days in culture, a low percentage of the colonies are still alive. However, after 6 days, 0% remain. Therefore, the antibiotic treatment should last for a minimum of 6 days.
Example Question #42 : How To Find Synthesis Of Data In Biology
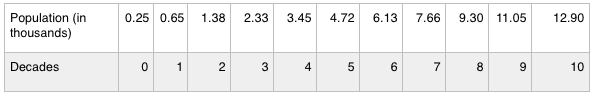
There is a certain species of rabbit that is known to reproduce quickly. 250 of these rabbits were introduced into a new environment, and their population was measured in ten year intervals.
Assuming that this species of rabbits breeds at the same rate, how many rabbits would there be in 20 years if the scientists had introduced 500 rabbits into the environment instead of 250?


This question is a little tricky. We can see that the relationship between the variables is not linear, so doubling the original number of rabbits does not necessarily double the number after 20 years.
If there are 500 rabbits to start, then we can look at the table between the starting year and the first decade to see where this population may exist in our given data. At some point during the first decade, as the population increased from 250 to 650 rabbits, it passed the population of 500. Since we know that the 500 population existed somewhere between year 0 and year 10, we can add 20 years to estimate the population after 20 years, if it started with 500 rabbits.


Substitute the populations that we know.

Our answer will be somewhere between 1380 and 2330, likely slightly closer to the higher value. Looking at our answer choices, we can choose 2,000.
Example Question #43 : How To Find Synthesis Of Data In Biology
There is a certain species of rabbit that is known to reproduce quickly. 250 of these rabbits were introduced into a new environment, and their population was measured in ten year intervals.
Based on the table above, how many rabbits should there be in 11 decades?


We can look at the last few decades of the table to estimate how the population will increase beyond the scope of the experiment.
Increase from decade 7 to 8:

Increase from decade 8 to 9:

Increase from decade 9 to 10:

Based on the trend, the next decade should show an increase of around 1,950, or a little more.

Based on this estimate, we can choose the answer to be 14,900.
Example Question #44 : How To Find Synthesis Of Data In Biology
There is a certain species of rabbit that is known to reproduce quickly. 250 of these rabbits were introduced into a new environment, and their population was measured in ten year intervals.
Assuming the same rate of change, how many rabbits would there be after one decade in the scientists had started with 650 rabbits instead of 250?


After one decade in the original experiment, there were 650 rabbits. One decade later (decade two in the experiment), there were 1,380 rabbits. If they had started with 650 rabbits, they would have had 1,380 rabbits after one decade.
Example Question #45 : How To Find Synthesis Of Data In Biology
There is a certain species of rabbit that is known to reproduce quickly. 250 of these rabbits were introduced into a new environment, and their population was measured in ten year intervals.
All rabbits in the population are either brown or white. After each decade, it is discovered that there is a constant ratio of two brown rabbits for every three white rabbits. Which of the following conclusions can be drawn?
White rabbits and brown rabbits reproduce with the same frequency
No conclusion can be drawn
White rabbits reproduce more frequently than brown rabbits
Brown rabbits are more likely to be eaten by predators
White rabbits and brown rabbits reproduce with the same frequency
If the ratio of brown to white rabbits is two to three, that means that for every two brown rabbits, there are three white rabbits. This ratio is constant across the decades.
This means that after 10 years, of the 650 rabbits in the population, 260 are brown and 390 are white.
After 20 years, of the 1,380 rabbits in the population, 552 are brown and 828 are white.
We can compare the increases in each color: there are 292 new brown rabbits and 438 new white rabbits. So, there are definitely more white rabbits than brown rabbits, but this does not tell us the rate of population growth. To find the rate of increase we need to use this formula:

This will give us the amount of change, relative to the starting amount.


Both populations increase by 
Example Question #322 : Biology
There is a certain species of rabbit that is known to reproduce quickly. 250 of these rabbits were introduced into a new environment, and their population was measured in ten year intervals.
What is the relationship between population and decade?
Indirect relationship
Direct relationship
Quadratic relationship
Exponential relationship
Exponential relationship
As the decade increases, the population also increases. This would indicate a direct relationship, except that the increase per decade is not constant. A direct relationship implies that the dependent variable can be graphed as a constant times the independent variable; this experiment cannot be graphed with a constant. Instead, we can see that the rate of population growth is increasing, suggesting an exponential relationship between population and decade.
Example Question #47 : How To Find Synthesis Of Data In Biology
Chemical reactions involve two main components, reactants and products. The reactants, often referred to as substrates, interact with each other and rearrange in order to be converted into products. The speeds of these reactions are often defined by substrate concentration and the presence of enzymes. Enzymes are referred to as catalysts. Peroxidase is traditionally derived from turnips; however, it is commonly found in many plant and animal cells. This enzyme helps plant cells by removing hydrogen peroxide from cells in the form of tetraguaiacol.

Study 1
A scientist wants to observe the production of tetraguaiacol by observing a reaction between hydrogen peroxide and guaiacol. The product of this reaction is orange-brown in color. The scientist measures the intensity of color in each sample using a spectrophotometer. In the control experiment, the scientist mixed the substrates together and measured the reaction rate. In the test experiment, a peroxidase enzyme was added to a new set of substrates and rate of reaction was measured. The results of these reactions are plotted in Figure 1.
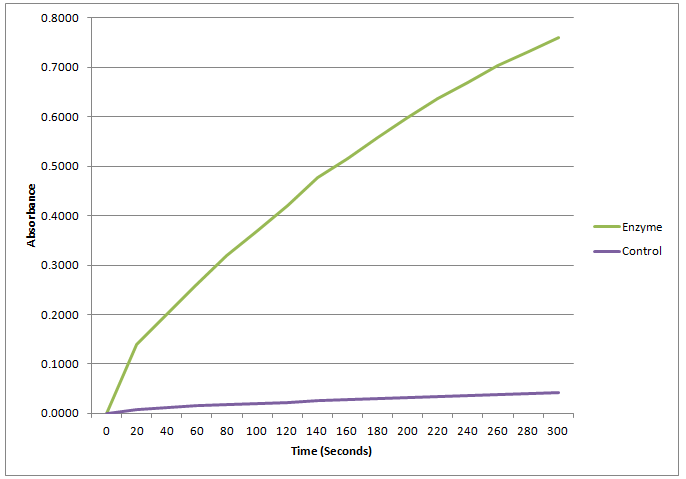
Figure 1
Study 2
A research team decides to study the effects of the peroxidase facilitated reaction in the presence of heat. Reaction rates are known to speed up when heat is applied; however, at a certain point enzymes, such as peroxidase, denature and the reaction slows. The scientists perform a control trial at room temperature ")


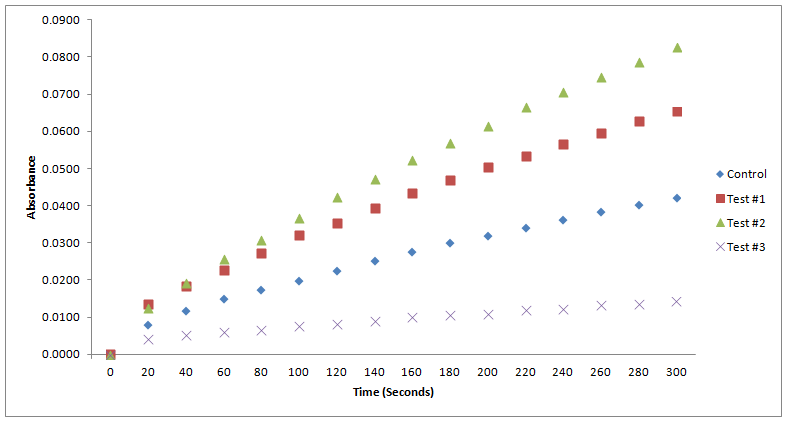
Figure 2
According to the passage, how may moles of guaiacol would have to react in excess of hydrogen peroxide to produce 


The question states that the reaction occurs in excess of hydrogen peroxide. This means that there is more than enough hydrogen peroxide present during the reaction to create the 

The ratio of guaiacol to tetraguaiacol is 
Therefore, in order to produce 

Example Question #48 : How To Find Synthesis Of Data In Biology
Chemical reactions involve two main components, reactants and products. The reactants, often referred to as substrates, interact with each other and rearrange in order to be converted into products. The speeds of these reactions are often defined by substrate concentration and the presence of enzymes. Enzymes are referred to as catalysts. Peroxidase is traditionally derived from turnips; however, it is commonly found in many plant and animal cells. This enzyme helps plant cells by removing hydrogen peroxide from cells in the form of tetraguaiacol.

Study 1
A scientist wants to observe the production of tetraguaiacol by observing a reaction between hydrogen peroxide and guaiacol. The product of this reaction is orange-brown in color. The scientist measures the intensity of color in each sample using a spectrophotometer. In the control experiment, the scientist mixed the substrates together and measured the reaction rate. In the test experiment, a peroxidase enzyme was added to a new set of substrates and rate of reaction was measured. The results of these reactions are plotted in Figure 1.
Figure 1
Study 2
A research team decides to study the effects of the peroxidase facilitated reaction in the presence of heat. Reaction rates are known to speed up when heat is applied; however, at a certain point enzymes, such as peroxidase, denature and the reaction slows. The scientists perform a control trial at room temperature ")


Figure 2
Did peroxidase increase the amount of tetraguaicol produced in Figure1?
Peroxidase greatly increased the amount of tetraguaicol produced in the reaction.
Peroxidase decreased the amount of tetraguaiacol produced in the reaction.
Peroxidase had no effect on the reaction.
Peroxidase slightly increased the amount of tetraguaiacol produced in the reaction.
Peroxidase greatly increased the amount of tetraguaicol produced in the reaction.
Peroxidase greatly increased the amount of tetraguaicol produced in the reaction.
The test group in Figure 1 contained peroxidase. When compared to the control, it is obvious that it greatly increased the amount of tetraguaiacol produced over the 300-second period. Tetraguaiacol production was greatly facilitated by the enzyme in the test. The other answers are incorrect because peroxidase's effect was not subtle, immeasurable, or detrimental to the production of tetraguaicol.
Example Question #49 : How To Find Synthesis Of Data In Biology
Chemical reactions involve two main components, reactants and products. The reactants, often referred to as substrates, interact with each other and rearrange in order to be converted into products. The speeds of these reactions are often defined by substrate concentration and the presence of enzymes. Enzymes are referred to as catalysts. Peroxidase is traditionally derived from turnips; however, it is commonly found in many plant and animal cells. This enzyme helps plant cells by removing hydrogen peroxide from cells in the form of tetraguaiacol.

Study 1
A scientist wants to observe the production of tetraguaiacol by observing a reaction between hydrogen peroxide and guaiacol. The product of this reaction is orange-brown in color. The scientist measures the intensity of color in each sample using a spectrophotometer. In the control experiment, the scientist mixed the substrates together and measured the reaction rate. In the test experiment, a peroxidase enzyme was added to a new set of substrates and rate of reaction was measured. The results of these reactions are plotted in Figure 1.
Figure 1
Study 2
A research team decides to study the effects of the peroxidase facilitated reaction in the presence of heat. Reaction rates are known to speed up when heat is applied; however, at a certain point enzymes, such as peroxidase, denature and the reaction slows. The scientists perform a control trial at room temperature ")


Figure 2
According to the passage, guiacol rids cells of hydrogen peroxide by producing what two products?
Tetraguaicol and hydrogen gas
Hydrogen peroxide and water
Tetraguaiacol and water
Four guaiacols, water, and hydrogen gas
Tetraguaiacol and water
Tetraguaiacol and water
The passage contains the chemical formula of the reaction.

The products of the reaction are located on the right side of the arrow. This reaction produces 1 mole of tetraguaiacol and four moles of water. Water's chemical formula is 
Example Question #50 : How To Find Synthesis Of Data In Biology
Chemical reactions involve two main components, reactants and products. The reactants, often referred to as substrates, interact with each other and rearrange in order to be converted into products. The speeds of these reactions are often defined by substrate concentration and the presence of enzymes. Enzymes are referred to as catalysts. Peroxidase is traditionally derived from turnips; however, it is commonly found in many plant and animal cells. This enzyme helps plant cells by removing hydrogen peroxide from cells in the form of tetraguaiacol.

Study 1
A scientist wants to observe the production of tetraguaiacol by observing a reaction between hydrogen peroxide and guaiacol. The product of this reaction is orange-brown in color. The scientist measures the intensity of color in each sample using a spectrophotometer. In the control experiment, the scientist mixed the substrates together and measured the reaction rate. In the test experiment, a peroxidase enzyme was added to a new set of substrates and rate of reaction was measured. The results of these reactions are plotted in Figure 1.
Figure 1
Study 2
A research team decides to study the effects of the peroxidase facilitated reaction in the presence of heat. Reaction rates are known to speed up when heat is applied; however, at a certain point enzymes, such as peroxidase, denature and the reaction slows. The scientists perform a control trial at room temperature ")


Figure 2
In Figure 2 of Study 2, the scientist observed the enzyme facilitated reaction in the presence of heat. What could explain the results found in Test 1 and Test 2?
One of the test reactions occured faster and one occured slower than the control trial.
The test reactions occurred faster than the control due to increased heat application.
The test reactions occurred faster than the control due to increased enzyme levels.
The test reactions did not differ from the control trial.
The test reactions occurred faster than the control due to increased heat application.
The test reactions occurred faster than the control due to increased heat application.
The passage stated that reactions occur faster in the presence of heat. As heat is increased, the reaction rate should increase until the enzyme reaches its point of denaturization. An enzyme denatures when conditions cause the enzyme to lose its shape and function. In Tests 1 and 2, the temperature of the reaction was increased. As the temperature increased so did the reaction times. This is the reason that Test 2 had a higher reaction rate than Test 1. The other answers are incorrect because they confuse these details.

Certified Tutor

Certified Tutor

All ACT Science Resources

