ACT Science : How to find synthesis of data in biology
Study concepts, example questions & explanations for ACT Science


All ACT Science Resources
Example Questions
Example Question #51 : How To Find Synthesis Of Data In Biology
Chemical reactions involve two main components, reactants and products. The reactants, often referred to as substrates, interact with each other and rearrange in order to be converted into products. The speeds of these reactions are often defined by substrate concentration and the presence of enzymes. Enzymes are referred to as catalysts. Peroxidase is traditionally derived from turnips; however, it is commonly found in many plant and animal cells. This enzyme helps plant cells by removing hydrogen peroxide from cells in the form of tetraguaiacol.

Study 1
A scientist wants to observe the production of tetraguaiacol by observing a reaction between hydrogen peroxide and guaiacol. The product of this reaction is orange-brown in color. The scientist measures the intensity of color in each sample using a spectrophotometer. In the control experiment, the scientist mixed the substrates together and measured the reaction rate. In the test experiment, a peroxidase enzyme was added to a new set of substrates and rate of reaction was measured. The results of these reactions are plotted in Figure 1.
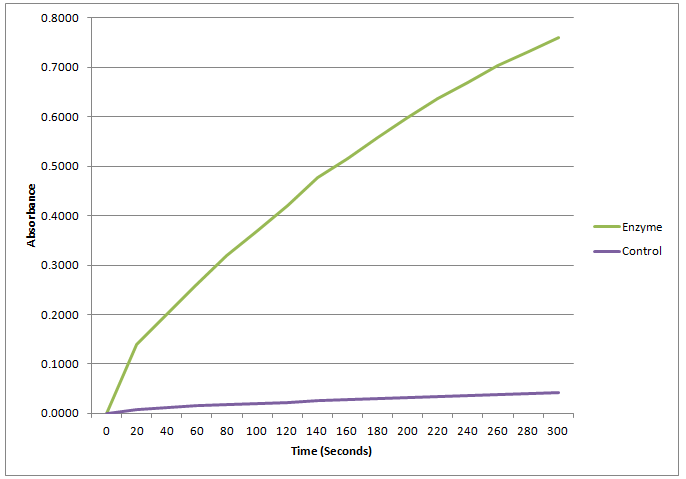
Figure 1
Study 2
A research team decides to study the effects of the peroxidase facilitated reaction in the presence of heat. Reaction rates are known to speed up when heat is applied; however, at a certain point enzymes, such as peroxidase, denature and the reaction slows. The scientists perform a control trial at room temperature ")


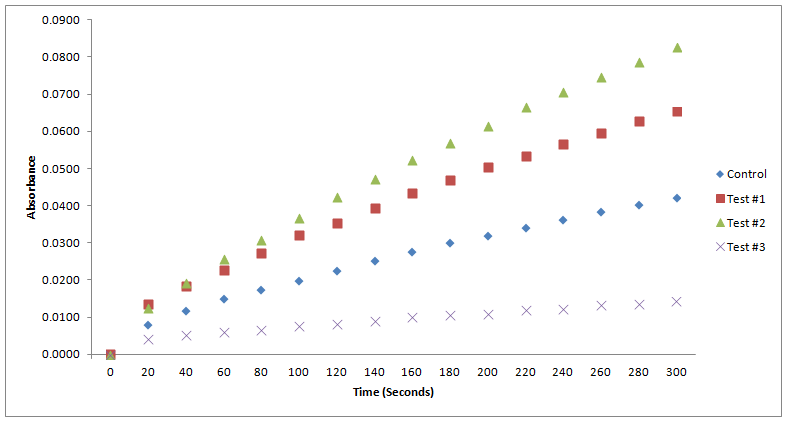
Figure 2
In Figure 2 of Study 2, the scientist observed the enzyme-facilitated reaction in the presence of heat. What could explain the results found in Test 3?
The enzyme denatured and lost its ability to catalyze the reaction.
The enzyme was unaffected by the heat application.
The enzyme ran out of proper substrate to catalyze.
The enzyme was reduced in quantity and could not catalyze the reaction.
The enzyme denatured and lost its ability to catalyze the reaction.
The enzyme denatured and lost its ability to catalyze the reaction.
This is the correct answer. The passage stated that the enzyme should increase the rate of reaction with increasing heat until it reaches the point to where it denatures. Tests 1 and 2 support this theory because the reactions increased with increased temperatures; however, in Test 3 the reaction rate was less than that of the control. The temperature of Test 3 was 
Example Question #52 : How To Find Synthesis Of Data In Biology
Survivorship curves are constructed and used to compare population growth and survival between species. A Type I curve is characterized by a population whose individuals live to old age, indicating that there is high survivorship in the early and middle years. These individuals produce few offspring and have long periods of parental care. In a Type II curve, there is a constant survivorship across the individuals’ life spans. A Type III curve is characterized by a population of individuals that possess low survivorship early in age; however, this is followed by high survivorship of older individuals. These species produce large numbers of offspring with little or no parental care. Figure 1 is a graphical representation of these curves.

Which of the following organisms is likely to possess a type 1 curve?
A fish species that produces many offspring per annual reproductive event
A rodent that has several offspring per annual reproductive event
None of these species possess a type 3 survivorship curve.
A large mammal that has 1 to 2 offspring per lifetime
A large mammal that has 1 to 2 offspring per lifetime
A large mammal that has 1 to 2 offspring per lifetime.
Large mammals are the correct organisms, because they have few offspring per lifetime. They also have lower rates of infant mortality, which allows most individuals to live to old age. These attributes create a type 3 curve of logistic survivorship.
Example Question #51 : How To Find Synthesis Of Data In Biology
Survivorship curves are constructed and used to compare population growth and survival between species. A Type I curve is characterized by a population whose individuals live to old age, indicating that there is high survivorship in the early and middle years. These individuals produce few offspring and have long periods of parental care. In a Type II curve, there is a constant survivorship across the individuals’ life spans. A Type III curve is characterized by a population of individuals that possess low survivorship early in age; however, this is followed by high survivorship of older individuals. These species produce large numbers of offspring with little or no parental care. Figure 1 is a graphical representation of these curves.
Which of the following organisms is likely to possess a type 2 curve?
A fish species that produces many offspring per annual reproductive event
None of these species possess a type 3 survivorship curve.
A large mammal that has 1 to 2 offspring per lifetime
A rodent that has several offspring per annual reproductive event
A rodent that has several offspring per annual reproductive event
A rodent that has several offspring per annual reproductive event.
Individuals that exhibit a type 2 curve possess constant survivorship across the lifespan. This would fit the attributes of a rodent that has several offspring per annual reproductive event. It would not fit the characteristics of large mammals or fish that produce offspring numbers that are not consistent with a type 2 curve.
Example Question #53 : How To Find Synthesis Of Data In Biology
Survivorship curves are constructed and used to compare population growth and survival between species. A Type I curve is characterized by a population whose individuals live to old age, indicating that there is high survivorship in the early and middle years. These individuals produce few offspring and have long periods of parental care. In a Type II curve, there is a constant survivorship across the individuals’ life spans. A Type III curve is characterized by a population of individuals that possess low survivorship early in age; however, this is followed by high survivorship of older individuals. These species produce large numbers of offspring with little or no parental care. Figure 1 is a graphical representation of these curves.
Which of the following organisms is likely to possess a type 3 curve?
None of these species possess a type 3 survivorship curve.
A fish species that produces many offspring per annual reproductive event
A rodent that has several offspring per annual reproductive event
A large mammal that has 1 to 2 offspring per lifetime
A fish species that produces many offspring per annual reproductive event
A fish species that produces many offspring per annual reproductive event.
This is the correct answer because this species possesses high infant mortality and high survivorship at older ages. The fact that the species produce large numbers of offspring is indicative of a type 3 organism. Rodents and large mammals do not possess characteristics that could classify them as type 3 organisms.
Example Question #54 : How To Find Synthesis Of Data In Biology
Survivorship curves are constructed and used to compare population growth and survival between species. A Type I curve is characterized by a population whose individuals live to old age, indicating that there is high survivorship in the early and middle years. These individuals produce few offspring and have long periods of parental care. In a Type II curve, there is a constant survivorship across the individuals’ life spans. A Type III curve is characterized by a population of individuals that possess low survivorship early in age; however, this is followed by high survivorship of older individuals. These species produce large numbers of offspring with little or no parental care. Figure 1 is a graphical representation of these curves.
A scientist studies a new invasive species. It is a type of sea urchin that that produces many offspring. The offspring possess a very low mortality rate and grow exponentially through several generations. These organisms would follow which type of survivorship curve?
Type 1
Type 3
None of the curves fit this organism's survivorship.
Type 2
None of the curves fit this organism's survivorship.
None of the curves fit this organisms survivorship.
The organism is an invasive species and; therefore, has few natural predators. It has reproductive characteristics of a type 3 organism but infant survival rates of a type 1 organism. It does not share a constant mortality rate as seen in a type 2 organism as indicated by its exponential growth.
Example Question #52 : How To Find Synthesis Of Data In Biology
A spectrophotometer measures specific light wavelengths emitted by a sample. The readings of the samples are compared to those on a standard curve of known values. The standard curve creates a line and the equation of this line can be used to extrapolate the concentration of a given substance in samples whose spectrophotometric measurements fall within range of the curve.

A scientist measures a sample and plots it on the standard curve of known values. Estimate the concentration of substance in this sample.

Cannot be determined


The correct answer is 


Example Question #51 : How To Find Synthesis Of Data In Biology
A spectrophotometer measures specific light wavelengths emitted by a sample. The readings of the samples are compared to those on a standard curve of known values. The standard curve creates a line and the equation of this line can be used to extrapolate the concentration of a given substance in samples whose spectrophotometric measurements fall within range of the curve.

A scientist measures a sample and finds that it has an absorbance of 
Cannot be determined
11.25
11.375
11.5
Cannot be determined
The concentration of substance cannot be extrapolated or calculated because its absorbance is greater than the highest value of the curve. Results at this level are meaningless as indicated in the passage.
Example Question #52 : How To Find Synthesis Of Data In Biology
A spectrophotometer measures specific light wavelengths emitted by a sample. The readings of the samples are compared to those on a standard curve of known values. The standard curve creates a line and the equation of this line can be used to extrapolate the concentration of a given substance in samples whose spectrophotometric measurements fall within range of the curve.
A scientist measures a sample and finds that it has an absorbance of 
0.95
1
Cannot be determined
0.975
Cannot be determined
The concentration of substance cannot be extrapolated or calculated because its absorbance is less than the lowest value of the curve. Results at this level are meaningless as indicated in the passage.
Example Question #340 : Act Science
Species competition is driven by a variety of factors. Resources such as water, food, sunlight, and suitable habitat are among the top contributors that influence interspecific and intraspecific competition. Interspecific is competition between different species and intraspecific competition is between members of the same species.
One interesting example of interspecific completion is that of two barnacle species that inhabit intertidal zones. Balanus balanoides inhabits the lower intertidal zone and Chthamalus stellatus inhabits the lower intertidal zone. A researcher attempts to study this phenomenon.
The researcher removes the Balanus species from the lower intertidal zone and observes that the Chthamalus species expands its range to inhabit the lower intertidal zone and the upper intertidal zone. The researcher then removes the Chthamalus species from the upper tidal zone of a different area and observes that theBalanus species does not extend its range. The researcher concludes that competition has allowed each species to exist simultaneously by forming specialized niches that promotes survivorship for each species.
Question Body
Which of the following best describes the species interaction that was observed when the researcher removed the Balanus species early in the study?
Interspecific competition
Commensalism
Intraspecific competition
None of the choices are correct.
Intraspecific competition
Intraspecific competition
This is the correct answer because when the Balanus species was removed only a single species (Chthamalus) remained. Because only one species existed; no interspecific competition could be observed. The other answers were not supported by the passage.
Example Question #55 : How To Find Synthesis Of Data In Biology
Species competition is driven by a variety of factors. Resources such as water, food, sunlight, and suitable habitat are among the top contributors that influence interspecific and intraspecific competition. Interspecific is competition between different species and intraspecific competition is between members of the same species.
One interesting example of interspecific completion is that of two barnacle species that inhabit intertidal zones. Balanus balanoides inhabits the lower intertidal zone and Chthamalus stellatus inhabits the lower intertidal zone. A researcher attempts to study this phenomenon.
The researcher removes the Balanus species from the lower intertidal zone and observes that the Chthamalus species expands its range to inhabit the lower intertidal zone and the upper intertidal zone. The researcher then removes the Chthamalus species from the upper tidal zone of a different area and observes that the Balanus species does not extend its range. The researcher concludes that competition has allowed each species to exist simultaneously by forming specialized niches that promotes survivorship for each species.
Researchers suggest that the Balanus species disrupts the Chthamalus species' ability to inhabit the lower intertidal zones because it is much larger and can physically remove the smaller Chthamalus without much effort. Does this information agree witht the data observed in the barnacle study?
None of the choices are correct.
No, there is not enough information to make a valid conclusion of the two studies.
No, it disagrees with the information in the study.
Yes, it agrees with the information in the study.
Yes, it agrees with the information in the study.
Yes this information directly correlates to the data obtained in the passage's research. The Chthamalus species was able to survive in the lower intertidal zone when its Balanus competitor was absent. This information indicates that the Balanus species is able to displace the Chthamalus species.


All ACT Science Resources

