ACT Science : How to find research summary in biology
Study concepts, example questions & explanations for ACT Science


All ACT Science Resources
Example Questions
Example Question #141 : Act Science
Scientists studied a species of termites and looked at their foraging habitats across the United States. The termite’s population in a given tree was measured by the level of decomposition within a tree due to the termites eating the bark. The experiment also kept track of the level of shade tolerance for each species of tree. For the species of trees in this experiment, shade tolerance fell into two main categorizes- shade tolerant (ST) and intermediate shade (IS). Lastly, they recorded the average amount of rainfall in that given month for the species location being observed. The chart below summarizes the data. Scientists hypothesized that the level of decomposition would be highest in tree species with a higher average rainfall. In addition, they hypothesized trees allowing more shade would allow for more termites, and in turn more decomposition.
|
|
Tsuga canadensis |
Morus rubra |
Pinus strobus |
Acer rubrum |
Arbutus menziesii |
Quercus lobata |
Juniperus scopulorum |
|
Decomposition (in ccm) |
2.38 |
3.21 |
1.01 |
.970 |
2.89 |
1.31 |
4.03 |
|
Shade tolerance |
ST |
ST |
IS |
IS |
ST |
IS |
ST |
|
Average rainfall |
47.27 |
50.89 |
43.26 |
41.65 |
46.87 |
44.98 |
52.75 |
Based on this experiment, the optimal foraging habitats of termites can best be described as __________.
dry, sunny environments
rainy, sunny environments
none of the answers listed
rainy, shady environments
dry, shady environments
rainy, shady environments
The experimental data shows that the greatest amount of termites are found in trees that have a high shade tolerance and get a lot of rain.
Example Question #142 : Act Science
An experiment was done to look at the effects of iodine supplements on the production of the thyroid hormone thyroxine. Individuals in the study were divided into categorizes based on the dosage of iodine supplemented. The chart below summarizes the data collected. THY1 is the average amount of thyroxine in the group prior to taking the supplement. THY2 is the average amount of thyroxine in the group after three months of taking supplements.
|
|
THY1 |
Dosage of Iodine |
THY2 |
|
Group 1 |
3.220 |
0 |
3.289 |
|
Group 2 |
2.988 |
0 |
3.102 |
|
Group 3 |
3.134 |
1mmg |
3.248 |
|
Group 4 |
3.387 |
3mmg |
4.001 |
|
Group 5 |
3.024 |
6mmg |
5.830 |
Group 2 was given a placebo supplement, which shows:
The placebo supplement resulted in a smaller thyroxine increase than the thyroxine increase in the control group.
The placebo supplement did not change the thyroxine level.
The placebo supplement resulted in a higher thyroxine increase than the thyroxine increase in the control group.
The placebo supplement resulted in a higher thyroxine decrease than the thyroxine decrease in the control group.
The placebo supplement resulted in a thyroxine increase that was the same as the thyroxine increase in the control group.
The placebo supplement resulted in a higher thyroxine increase than the thyroxine increase in the control group.
Group 2 had a higher thyroxine increase ( a .114 difference) than the thyroxine increase in Group 1 (0.069).
Example Question #143 : Act Science
An experiment was done to look at the effects of iodine supplements on the production of the thyroid hormone thyroxine. Individuals in the study were divided into categorizes based on the dosage of iodine supplemented. The chart below summarizes the data collected. THY1 is the average amount of thyroxine in the group prior to taking the supplement. THY2 is the average amount of thyroxine in the group after three months of taking supplements.
|
|
THY1 |
Dosage of Iodine |
THY2 |
|
Group 1 |
3.220 |
0 |
3.289 |
|
Group 2 |
2.988 |
0 |
3.102 |
|
Group 3 |
3.134 |
1mmg |
3.248 |
|
Group 4 |
3.387 |
3mmg |
4.001 |
|
Group 5 |
3.024 |
6mmg |
5.830 |
The results of this experiment strengthen the theory that:
Iodine supplements have a smaller impact when at higher dosages.
Iodine supplements do not have an impact when at high dosages.
Iodine supplements have a greater impact when at higher dosages.
Iodine supplements do not have any impact on Thyroxine levels.
Iodine supplements have a greater impact when at smaller dosages.
Iodine supplements have a greater impact when at higher dosages.
When looking at the chart, the higher the thyroxine level, the greater the difference between THY1 and THY2.
Example Question #144 : Act Science
Mitochondria make 90% of the energy needed by the body to sustain life. The Mitochondrial Free Radical Theory of Aging (MFRTA) theorizes that individuals who live longest produce fewer mitochondrial oxygen reactive species than individuals that have a shorter life span. Therefore, lifespan will increase if fewer mtROS are produced, and lifespan will decrease if more mtROS are produced. An experiment was done to test this theory, and the results are shown in the chart below. Four test groups of flies were involved, two groups consisted of females, and two groups consisted of males.
|
Test group 1 |
Test group 2 |
Test group 3
|
Test group 4 |
|
|
# of mtROS |
3.9 |
2.5 |
3.2 |
2.7 |
|
Lifespan |
110 days |
120 days |
95 days |
89 days |
Based on this experiment, a test group living in a low oxygen environment would:
have a longer lifespan.
produce a higher mtROS amount
None of the answers listed
have a shorter lifespan
produce a lower mtROS amount
None of the answers listed
We do not know the relationship between a low-oxygen environment and the mtROS amount. One might hypothesize that a low-oxygen environment would lower the influence of the mitochondrial oxygen reactive species because there is less oxygen to react with. However, this experiment does not begin to address this issue, therefore no conclusion can be made.
Example Question #151 : Act Science
A biologist wanted to do an experiment involving two species of large cat (species A and species B) around a potential new food source.
He isolated the populations of each cat in a location that closely approximated their natural environment, except this potential new food source was the only food source available to them.
Experiment 1:
When species A was left alone with the new food source, their numbers decreased rapidly until none were left.
Experiment 2:
When species B was left alone with the new food source, their numbers increased and the species flourished.
Experiment 3:
When an equal number of species A and B were placed with the new food source, both species maintained relatively constant numbers.
Which of the following is true about species A?
They can use species B as a food source
They can use the potential food source as a food source
They are less aggressive than species B
They have short life spans
They can use species B as a food source
Based upon experiment 3, we see that when species A and B are together, their population levels stay constant. Since species B has a tendency to grow their population when around the food source, something must be keeping the population down. Since species A has a tendency to die quickly when around the food source, something else must be providing it nourishment.
If species A preys on species B, then species A will be able to gain nourishment to prevent it from dying out and species B will not be able to increase to excessive numbers. This relationship would explain the constant populations when both species are together with the food source.
Example Question #152 : Act Science
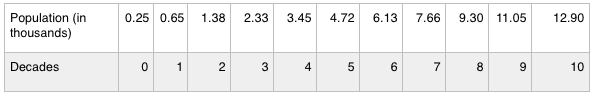
There is a certain species of rabbit that is known to reproduce quickly. 250 of these rabbits were introduced into a new environment, and their population was measured in ten year intervals.
Which of the following would be the most accurate conclusion for this experiment?
The rabbit population increases exponentially
The rabbit population is independent of environment
The rabbit population increases at a constant rate
The new environment allows an increase in population growth rate
The rabbit population increases exponentially
The population increases exponentially. It increases by 0.4 in the first decade, 0.73 in the second, 1.05 in the third, etc. The ever increasing rate of change tells us that the population is not increasing at a constant rate, but instead at an exponential rate.
We cannot draw conclusions about the effect of the environment, as there is no existing data about other environments to compare with the experimental data.
Example Question #153 : Act Science
There is a certain species of rabbit that is known to reproduce quickly. 250 of these rabbits were introduced into a new environment, and their population was measured in ten year intervals.
If this experiment were recreated in an environment in which the rabbits had an even more plentiful source of food, how would that affect the results?
The population growth rate would increase
The population growth rate would decrease
The population growth rate would not change
The effect cannot be determined
The effect cannot be determined
Food was not mentioned at all in the original experiment. We know only that the rabbits are in a new environment, and that we are measuring population and time. Since we do not know anything about the effect of food, we cannot draw any conclusion.
Example 1: plentiful food allows for the survival of more progeny, increasing the rate of population growth.
Example 2: plentiful food leads to obesity in the rabbits, leading to earlier deaths and a decrease in the rate of population growth.
Example 3: though food is more abundant, the rabbits still consume the same amount and the change has no effect on the rate of population growth.
Though the first example seems the most likely, there is simply no information that would allow us to rule out the other two.
Example Question #154 : Act Science
An experiment was done to look at the effects of iodine supplements on the production of the thyroid hormone thyroxine. Individuals in the study were divided into categorizes based on the dosage of iodine supplemented. The chart below summarizes the data collected. THY1 is the average amount of thyroxine in the group prior to taking the supplement. THY2 is the average amount of thyroxine in the group after three months of taking supplements.
|
|
THY1 |
Dosage of Iodine |
THY2 |
|
Group 1 |
3.220 |
0 |
3.289 |
|
Group 2 |
2.988 |
0 |
3.102 |
|
Group 3 |
3.134 |
1mmg |
3.248 |
|
Group 4 |
3.387 |
3mmg |
4.001 |
|
Group 5 |
3.024 |
6mmg |
5.830 |
The results of the experiment show:
Iodine supplements do not have an effect on Thyroxine levels.
There is a strong relationship between the increase in thyroxin levels and the amount of iodine supplements administered.
Thyroxine levels tend to decrease over a three month period, unbiased of iodine supplemental amounts.
None of the choices listed.
Thyroxine levels tend to stay the same over a three month period, unbiased of iodine supplemental amounts.
There is a strong relationship between the increase in thyroxin levels and the amount of iodine supplements administered.
The greater the dosage of iodine supplements administered, the greater the increase in thyroxine levels.
Example Question #155 : Act Science
Species distribution is a key component to analyze ecological systems. Species may inhabit a system in a variety of ways. Several of these types of distribution include the following: clustered, uniformed, and randomized. Clustered groupings are the most common. These species tend to inhabit areas in close packs of three or more organisms. These may consist of mating partners, packs, or families of organisms. Uniformed distribution occurs when organisms of a species inhabit a particular area that is not disrupted by organisms of the same species. This could be accomplished by pheromones, toxins, or aggressive behavior that marks an organism’s territory. Last, the most uncommon species distribution is randomized distribution. This distribution rarely occurs in nature and is classified as a scattering of organisms with no discernible pattern or arrangement.
A species of oak tree grows in deciduous, hardwood forests. This species grows and germinates in close proximity to one another if sunlight and resources can support growing numbers. The trees are interdispersed between other hardwoods including birches and cherries. What type of distribution does this species of oak tree best represent?
Clustered
None of the distribution choices are correct.
Uniformed
Randomized
Clustered
The correct distribution pattern is clustered distribution. The question stated that new oak trees grow in close proximity to the parent oak. These species are also located throughout a forest that contains other hardwood trees. This indicates that the trees will grow in clustered patterns throughout its environment.
Example Question #156 : Act Science
Species distribution is a key component to analyze ecological systems. Species may inhabit a system in a variety of ways. Several of these types of distribution include the following: clustered, uniformed, and randomized. Clustered groupings are the most common. These species tend to inhabit areas in close packs of three or more organisms. These may consist of mating partners, packs, or families of organisms. Uniformed distribution occurs when organisms of a species inhabit a particular area that is not disrupted by organisms of the same species. This could be accomplished by pheromones, toxins, or aggressive behavior that marks an organism’s territory. Last, the most uncommon species distribution is randomized distribution. This distribution rarely occurs in nature and is classified as a scattering of organisms with no discernible pattern or arrangement.
A wildflower releases an amino-acid based chemical that creates a 6 square centimeter plot of infertile ground. What type of distribution is this organism exhibiting?
Randomized
None of the distribution choices are correct.
Clustered
Uniformed
Uniformed
The plants exhibit a uniformed distribution. The chemicals released make ground around the wildflower infertile. In doing so, the plants will reproduce in a grid like pattern in which all flowers are distanced evenely from one another due to chemical signals.

Certified Tutor

Certified Tutor

All ACT Science Resources

