ACT Math : Graphing
Study concepts, example questions & explanations for ACT Math


All ACT Math Resources
Example Questions
Example Question #1 : Graphing
Solve and graph the following inequality:


To solve the inequality, the first step is to add 


The second step is to divide both sides by 


To graph the inequality, you draw a straight number line. Fill in the numbers from 

The graph should look like:

Example Question #2 : How To Graph A Two Step Inequality
Points ")
")
^{2}+(y-3)^{2}=3")
^{2}+(y-3)^{2}=9")
^{2}+(y+3)^{2}=9")
^{2}+(y+3)^{2}=9")
^{2}+(y+3)^{2}=3")
If we plug the points ")
")
^{2}+(y-3)^{2}=9")

")
Example Question #1 : Graphing
Which of the following lines is perpendicular to the line 


The key here is to look for the line whose slope is the negative reciprocal of the original slope.
In this case, 

Therefore, the equation of the line which is perpendicular to the original equation is:
Example Question #193 : Coordinate Plane
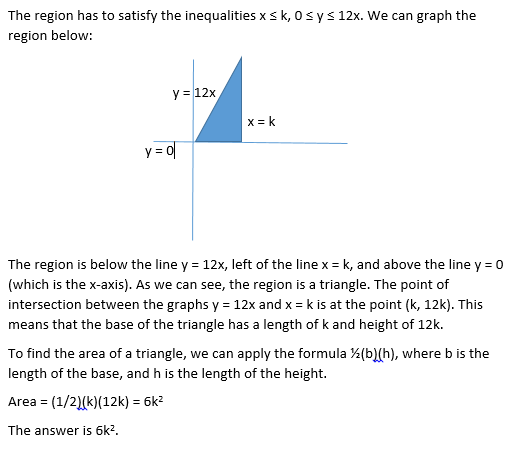
Let D be the region on the (x,y) coordinate plane that contains the solutions to the following inequalities:


Which of the following expressions, in terms of 


Example Question #3 : Graphing
A triangle is made up of the following points:
, (-3,5), (0,4) \right \}")
What are the points of the inverse triangle?
, (5,-3), (4,0) \right \}")
, (-5,3), (-4,0) \right \}")
, (3,5), (0,4) \right \}")
, (3,-5), (0,-4) \right \}")
, (-3,-5), (0,-4) \right \}")
The inverse of a function has all the same points as the original function, except the x values and y values are reversed. The same rule applies to polygons such as triangles.
Example Question #192 : Graphing
Electrical power can be generated by wind, and the magnitude of power will depend on the wind speed. A wind speed of 


The simplest way to solve this problem is to plug all of the answer choices into the provided equation, and see which one results in a power of 

Alternatively, one could set up the equation,

If we were to factor we would look for factors of c that when added together give us the value in b when we are in the form,

In our case 


Thus the following factoring would solve this problem.
(v-8)=0")
Then set each binomial equal to zero and solve for v.


Since we can't have a negative power our answer is 
Example Question #193 : Graphing
Compared to the graph 
^{2}-5")


The ")

Example Question #1 : Graphing
The graph of 
")
")


To answer this question, we need to correctly identify where to plug in our given values and solve for 
Points on a graph are written in coordinate pairs. These pairs show the 

")


We must now plug in our
^{2}+6")
We can now begin to solve for 

^{2}+6\rightarrow 2a=-4+6\rightarrow2a=2")

Therefore, the value of 

Example Question #1 : How To Graph Complex Numbers
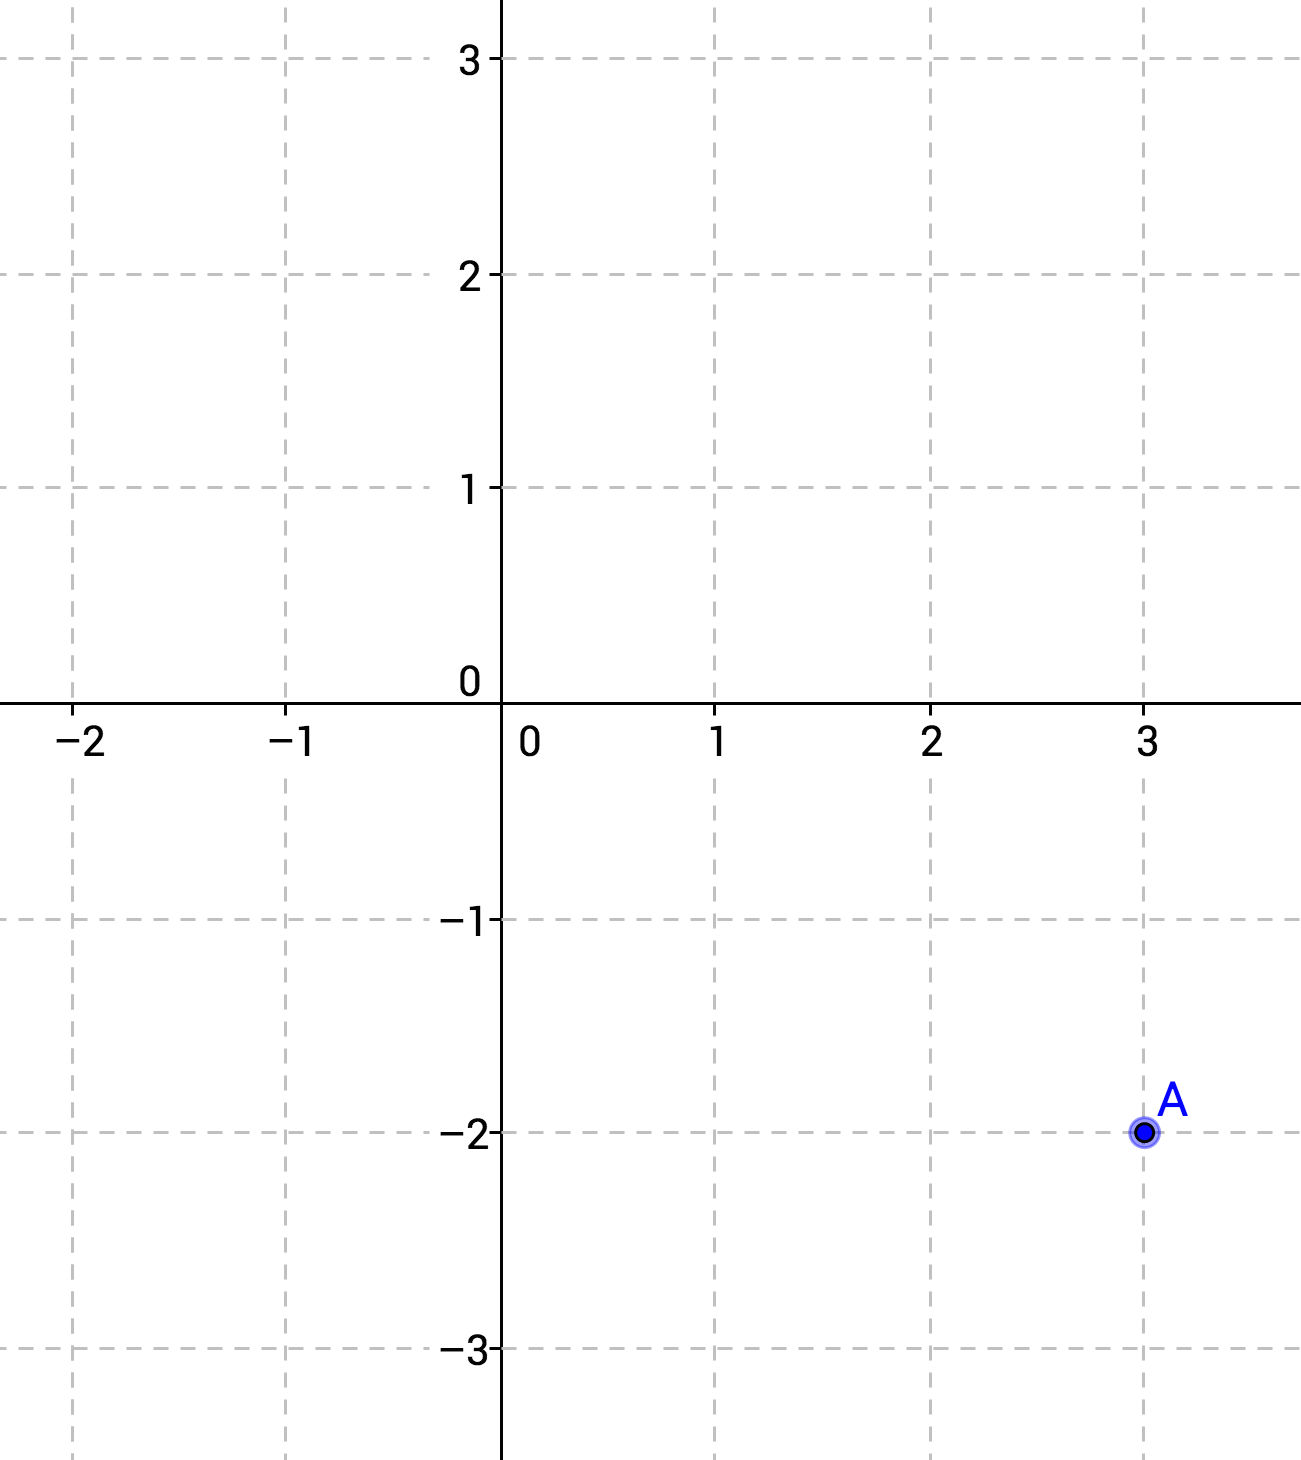
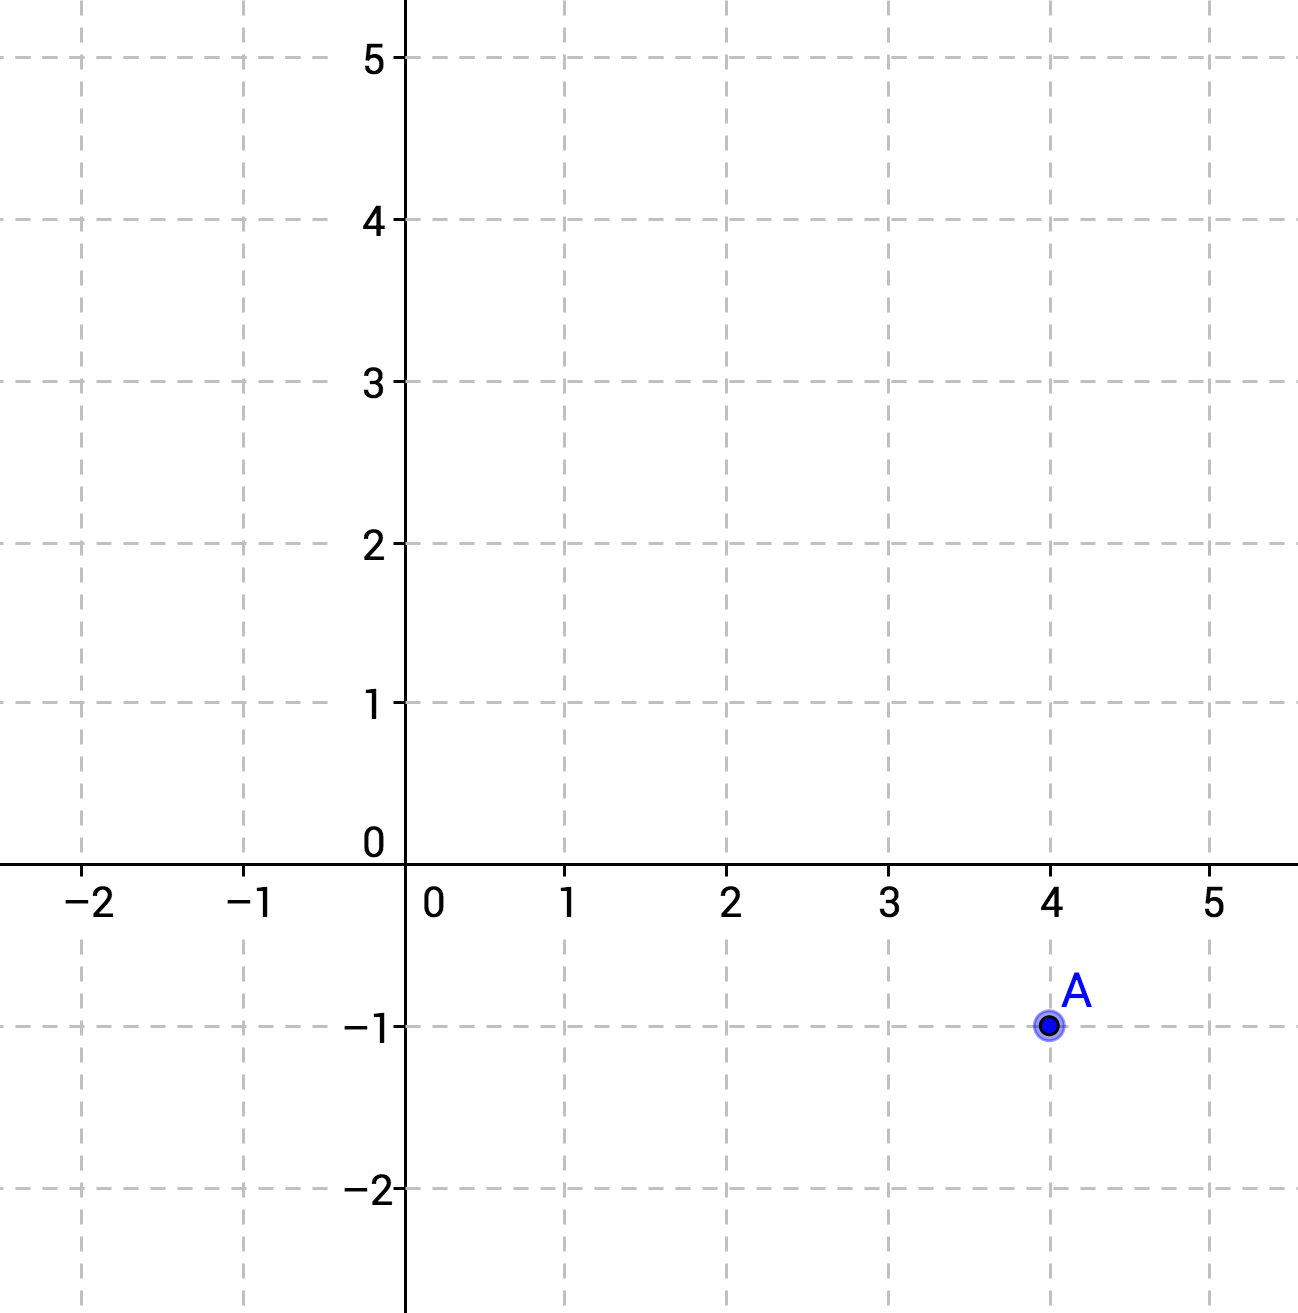
Point A represents a complex number. Its position is given by which of the following expressions?


Complex numbers can be represented on the coordinate plane by mapping the real part to the x-axis and the imaginary part to the y-axis. For example, the expression 
")
Here, we are given the graph and asked to write the corresponding expression.


Example Question #2 : How To Graph Complex Numbers
Which of the following graphs represents the expression 
Complex numbers cannot be represented on a coordinate plane.
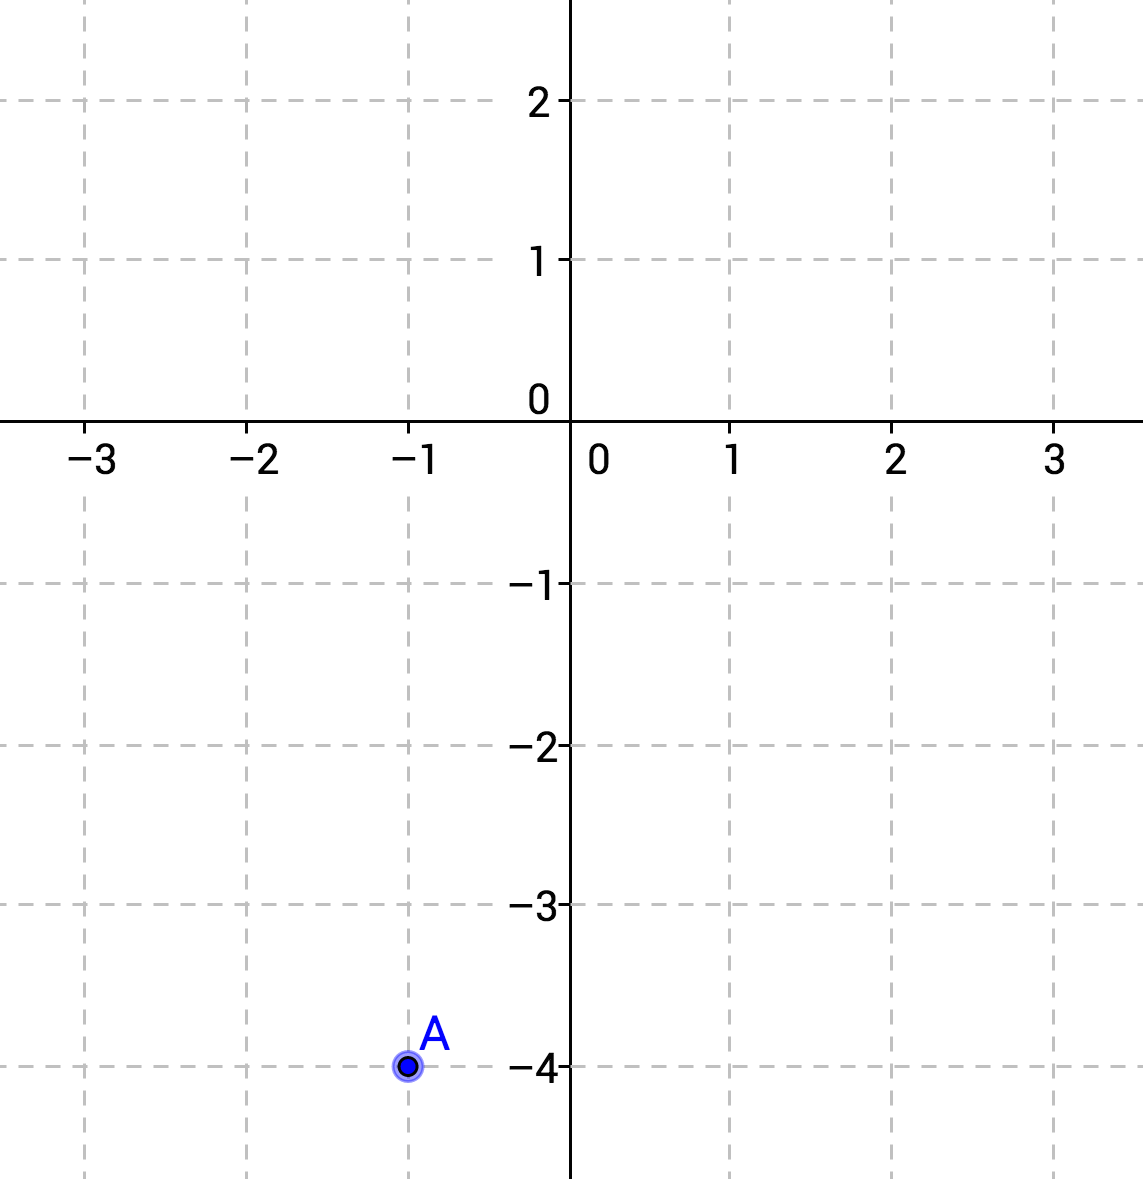
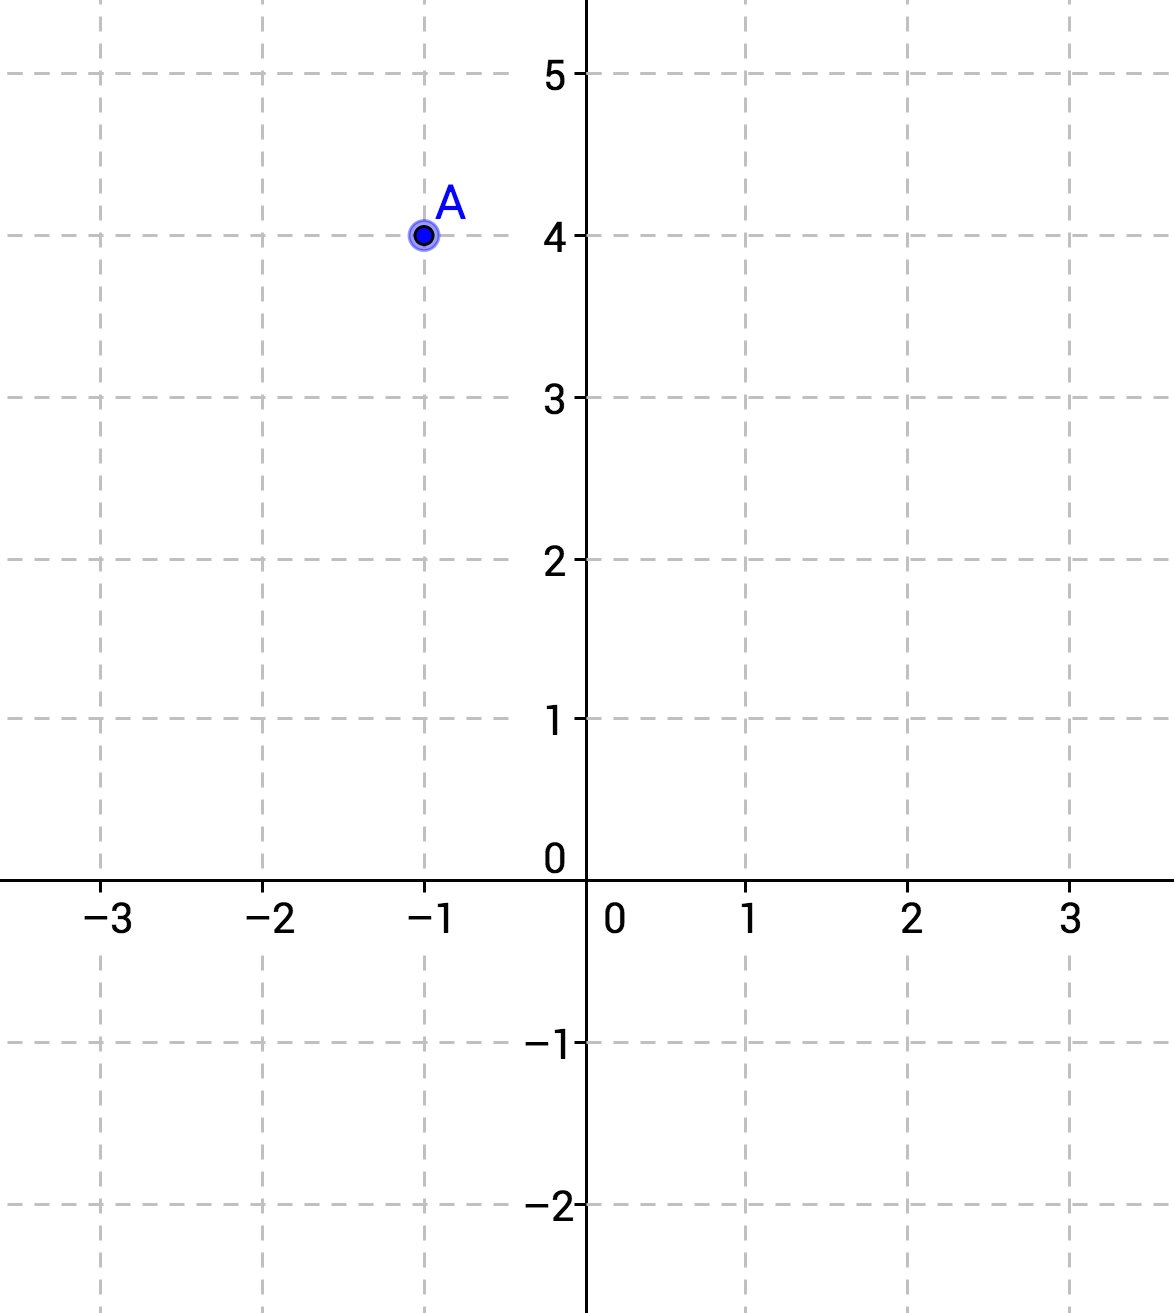
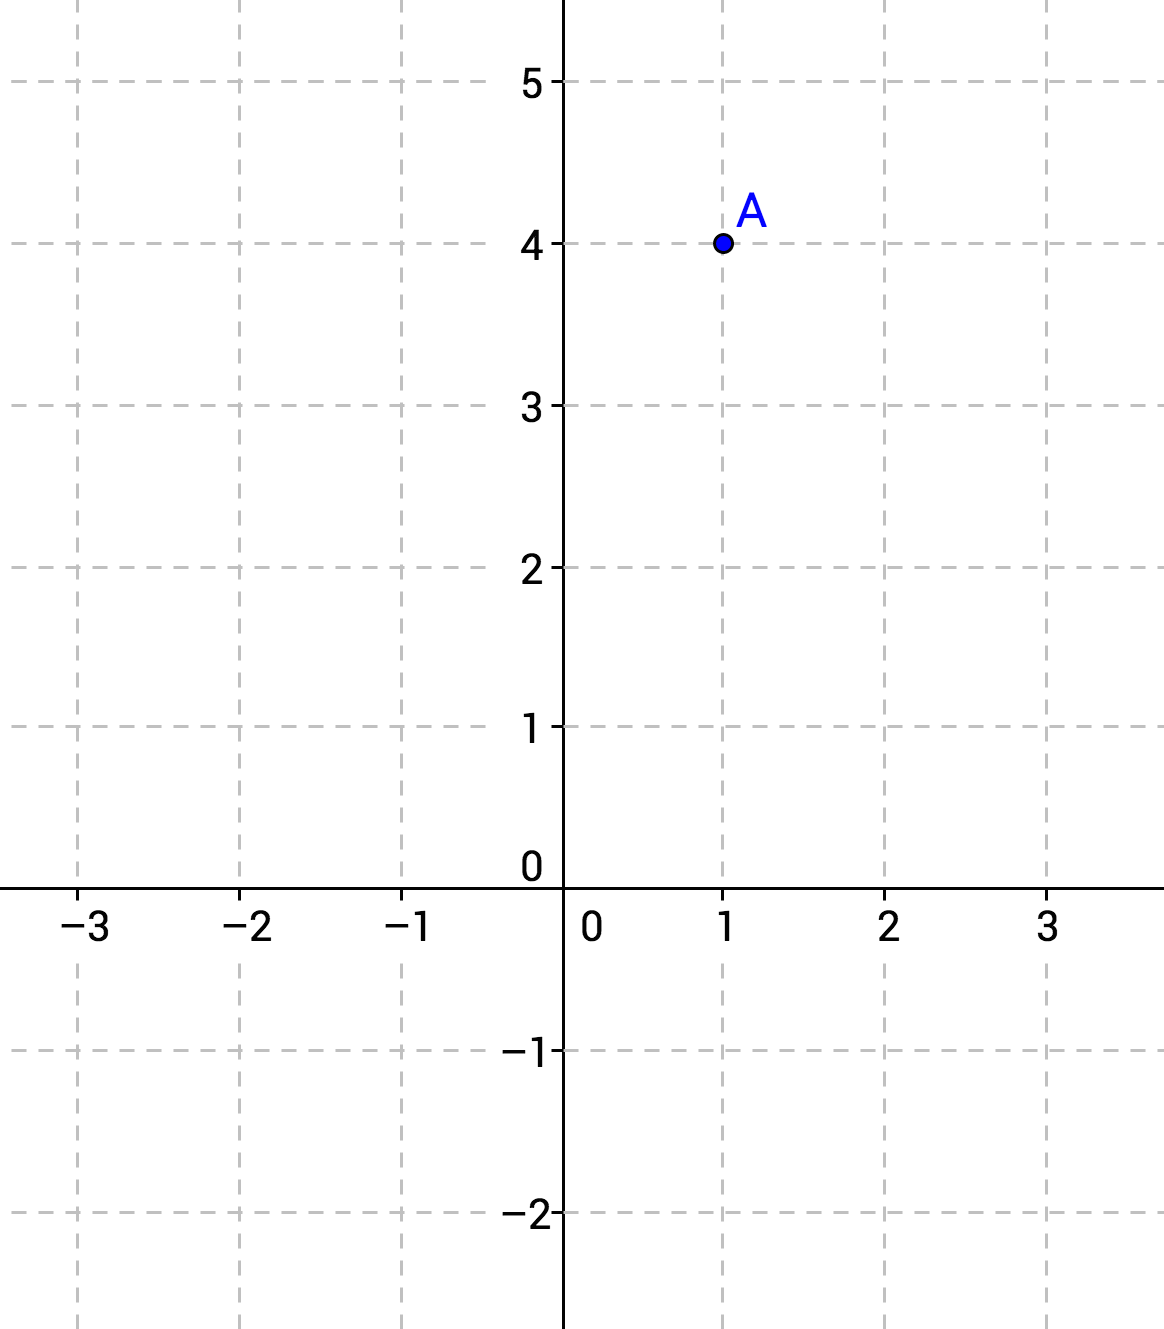
Complex numbers can be represented on the coordinate plane by mapping the real part to the x-axis and the imaginary part to the y-axis. For example, the expression 
")
Here, we are given the complex number 


")

Certified Tutor

Certified Tutor

All ACT Math Resources

