ACT Math : Graphing
Study concepts, example questions & explanations for ACT Math


All ACT Math Resources
Example Questions
Example Question #3 : How To Graph A Line
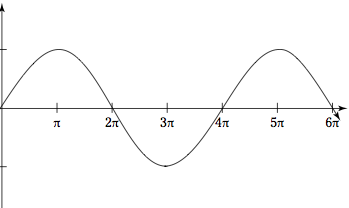
What is the amplitude of the function if the marks on the y-axis are 1 and -1, respectively?
2π
3π
0.5
1
π
1
The amplitude is half the measure from a trough to a peak.
Example Question #4 : How To Graph A Line
What is the midpoint between ")
")
")
")
None of the answers are correct
")
")
The x-coordinate for the midpoint is given by taking the arithmetic average (mean) of the x-coordinates of the two end points. So the x-coordinate of the midpoint is given by
\div2=4")
The same procedure is used for the y-coordinates. So the y-coordinate of the midpoint is given by
\div2=4")
Thus the midpoint is given by the ordered pair
")
Example Question #61 : Graphing
If the graph has an equation of 


Example Question #51 : New Sat Math Calculator
The equation 
Cannot be determined
I
IV
III
II
III
Plug in 

 + 2y = 6")

Thus, ")
Plug in 

 = 6")

")
Now we know that the line passes through the points ")
")
A quick sketch of the two points reveals that the line passes through all but the third quadrant.
Example Question #62 : Graphing
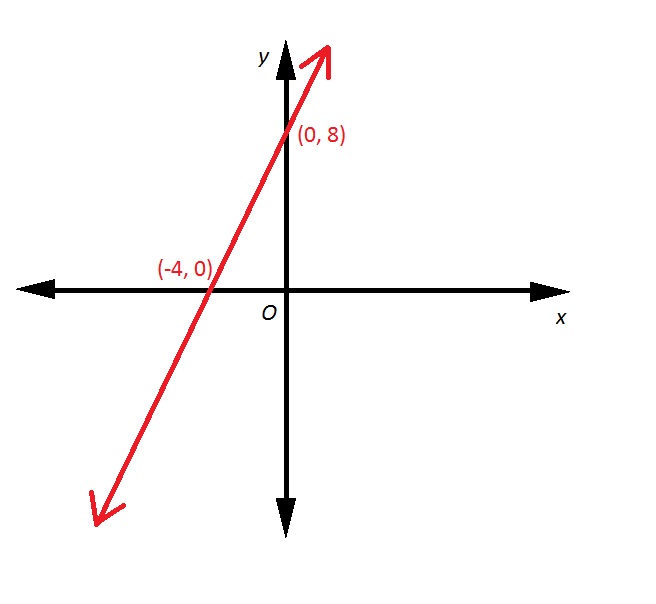
Refer to the above red line. A line is drawn perpendicular to that line, and with the same 


First, we need to find the slope of the above line.
The slope of a line. given two points , (x_{2}, y_{2})")

Set 
} = \frac{8}{4} = 2")
The slope of a line perpendicular to it has as its slope the opposite of the reciprocal of 2, which would be 

")


Example Question #1 : Graphing Functions
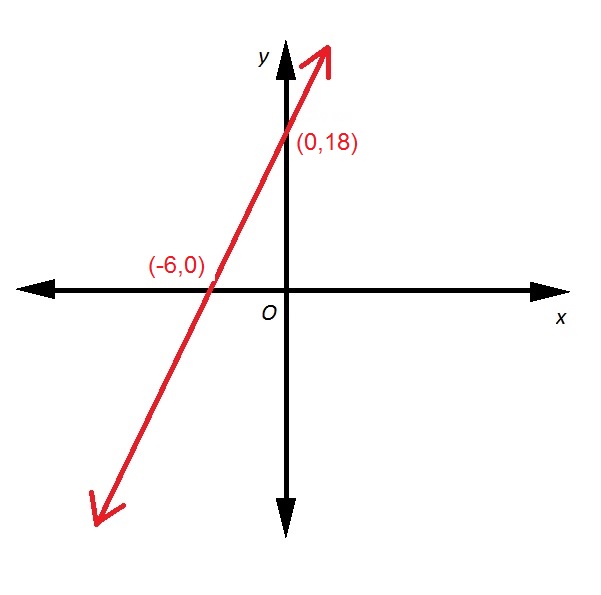
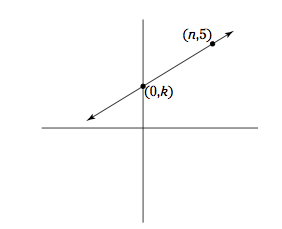
Refer to the above diagram. If the red line passes through the point ")


One way to answer this is to first find the equation of the line.
The slope of a line. given two points , (x_{2}, y_{2})")

Set 
} = \frac{18}{6} = 3")
The line has slope 3 and 
")


Now substitute 4 for 


Example Question #63 : Graphing
Best friends John and Elliot are throwing javelins. The height of John’s javelin is described as f(x) = -x2 +4x, and the height of Elliot’s javelin is described as f(x) = -2x2 +6x, where x is the horizontal distance from the origin of the thrown javelin. Whose javelin goes higher?
Insufficient information provided
The javelins reach the same height
Elliot’s
John’s
Elliot’s
When graphed, each equation is a parabola in the form of a quadratic. Quadratics have the form y = ax2 + bx + c, where –b/2a = axis of symmetry. The maximum height is the vertex of each quadratic. Find the axis of symmetry, and plug that x-value into the equation to obtain the vertex.
Example Question #64 : Graphing
Where does the following equation intercept the x-axis?

")
")
")
")
")
")
")
")
")
To determine where an equation intercepts a given axis, input 0 for either 


Now solve for 
Note that in its present form, this is a quadratic equation. In this scenario, we must find two factors of 12, that when added together, equal 7. Quickly, we see that 4 and 3 fit these conditions, giving:
(x + 3)")
Solving for 


Example Question #3 : How To Graph A Quadratic Function
Where does the following equation intercept the 

")
")
")
")
")
")
")
")
")
")
The x intercept of an equation is the point at which it crosses the x-axis. To find the x intercept, plug in 


To solve for 


\left ( x-3\right )")
We can set each of these equal to 


The x intercepts occur at these 
")
")
Example Question #2 : How To Graph A Quadratic Function
Where does the following equation intercept the 

")
")
")
")
")
")
")
")
")
")
The x intercept of an equation is the point at which it crosses the x-axis. To find the x intercept, plug in 


This equation is not easily factored, so to solve for 

With the equation in the form


Plugging these values into the quadratic formula, we get:
\left (-9 \right )}}{2\left (1 \right )} = \frac{-5 \pm \sqrt{61}}{2}")
Find the two solutions for 


The x intercepts occur at these 
")

Certified Tutor

Certified Tutor

All ACT Math Resources

