SAT II Math I : Quartiles and Interquartile Range
Study concepts, example questions & explanations for SAT II Math I


All SAT II Math I Resources
Example Questions
Example Question #11 : How To Find Interquartile Range
Find the interquartile range of the following number set:


97

How do you find the interquartile range?
We can find the interquartile range or IQR in four simple steps:
- Order the data from least to greatest
- Find the median
- Calculate the median of both the lower and upper half of the data
- The IQR is the difference between the upper and lower medians
Step 1: Order the data
In order to calculate the IQR, we need to begin by ordering the values of the data set from the least to the greatest. Likewise, in order to calculate the median, we need to arrange the numbers in ascending order (i.e. from the least to the greatest).
Let's sort an example data set with an odd number of values into ascending order.

}: 2, 2, 3, 3, 4, 5, 6, 9, 11")
Now, let's perform this task with another example data set that is comprised of an even number of values.

Rearrange into ascending order.
}: 1, 2, 2, 3, 4, 4, 7, 8, 9, 11")
Step 2: Calculate the median
Next, we need to calculate the median. The median is the "center" of the data. If the data set has an odd number of data points, then the mean is the centermost number. On the other hand, if the data set has an even number of values, then we will need to take the arithmetic average of the two centermost values. We will calculate this average by adding the two numbers together and then dividing that number by two.
First, we will find the median of a set with an odd number of values. Cross out values until you find the centermost point

The median of the odd valued data set is four.
Now, let's find the mean of the data set with an even number of values. Cross out values until you find the two centermost points and then calculate the average the two values.

Find the average of the two centermost values.


The median of the even valued set is four.
Step 3: Upper and lower medians
Once we have found the median of the entire set, we can find the medians of the upper and lower portions of the data. If the data set has an odd number of values, we will omit the median or centermost value of the set. Afterwards, we will find the individual medians for the upper and lower portions of the data.

Omit the centermost value.

Find the median of the lower portion.

Calculate the average of the two values.


The median of the lower portion is

Find the median of the upper portion.

Calculate the average of the two values.


The median of the upper potion is

If the data set has an even number of values, we will use the two values used to calculate the original median to divide the data set. These values are not omitted and become the largest value of the lower data set and the lowest values of the upper data set, respectively. Afterwards, we will calculate the medians of both the upper and lower portions.

Find the median of the lower portion.

The median of the lower portion is two.
Find the median of the upper portion.

The median of the upper portion is eight.
Step 4: Calculate the difference
Last, we need to calculate the difference of the upper and lower medians by subtracting the lower median from the upper median. This value equals the IQR.
Let's find the IQR of the odd data set.


Finally, we will find the IQR of the even data set.


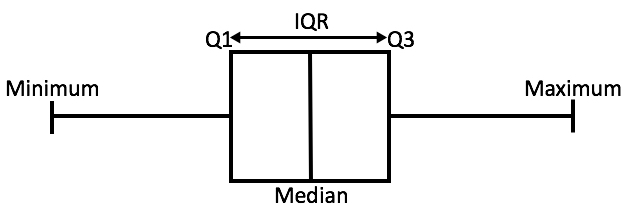
In order to better illustrate these values, their positions in a box plot have been labeled in the provided image.
Now that we have solved a few examples, let's use this knowledge to solve the given problem.
Solution:
Find the interquartile range of the following number set:

To find the interquartile range we must first arrange the terms in increasing order.

Now, to find the interquartile range, we need to find the median

Because 97 is the middle value, it is our median.
Next, we need to find quartile 1 and quartile 2. These are sort of like the medians of each half of our data set.
Because we have six terms in each half, we will need to average the two middle terms.


Next, find the interquartile range by finding the following:

So our interquartile range is 284
Example Question #12 : How To Find Interquartile Range
Find the interquartile range of the data set:


How do you find the interquartile range?
We can find the interquartile range or IQR in four simple steps:
- Order the data from least to greatest
- Find the median
- Calculate the median of both the lower and upper half of the data
- The IQR is the difference between the upper and lower medians
Step 1: Order the data
In order to calculate the IQR, we need to begin by ordering the values of the data set from the least to the greatest. Likewise, in order to calculate the median, we need to arrange the numbers in ascending order (i.e. from the least to the greatest).
Let's sort an example data set with an odd number of values into ascending order.
Now, let's perform this task with another example data set that is comprised of an even number of values.
Rearrange into ascending order.
Step 2: Calculate the median
Next, we need to calculate the median. The median is the "center" of the data. If the data set has an odd number of data points, then the mean is the centermost number. On the other hand, if the data set has an even number of values, then we will need to take the arithmetic average of the two centermost values. We will calculate this average by adding the two numbers together and then dividing that number by two.
First, we will find the median of a set with an odd number of values. Cross out values until you find the centermost point
The median of the odd valued data set is four.
Now, let's find the mean of the data set with an even number of values. Cross out values until you find the two centermost points and then calculate the average the two values.
Find the average of the two centermost values.
The median of the even valued set is four.
Step 3: Upper and lower medians
Once we have found the median of the entire set, we can find the medians of the upper and lower portions of the data. If the data set has an odd number of values, we will omit the median or centermost value of the set. Afterwards, we will find the individual medians for the upper and lower portions of the data.
Omit the centermost value.
Find the median of the lower portion.
Calculate the average of the two values.
The median of the lower portion is
Find the median of the upper portion.
Calculate the average of the two values.
The median of the upper potion is
If the data set has an even number of values, we will use the two values used to calculate the original median to divide the data set. These values are not omitted and become the largest value of the lower data set and the lowest values of the upper data set, respectively. Afterwards, we will calculate the medians of both the upper and lower portions.
Find the median of the lower portion.
The median of the lower portion is two.
Find the median of the upper portion.
The median of the upper portion is eight.
Step 4: Calculate the difference
Last, we need to calculate the difference of the upper and lower medians by subtracting the lower median from the upper median. This value equals the IQR.
Let's find the IQR of the odd data set.
Finally, we will find the IQR of the even data set.
In order to better illustrate these values, their positions in a box plot have been labeled in the provided image.
Now that we have solved a few examples, let's use this knowledge to solve the given problem.
Solution:
Write the formula for the interquartile range.

Determine the median of the dataset. Since the dataset is already in chronological order, the median is 8.
To the left of the median, there are three numbers 1,3, and 5. The 

Find the medians.


Input the numbers into the equation and solve for the interquartile range.

The answer is 
Example Question #793 : Sat Subject Test In Math I
Find the interquartile range of the following set of numbers.


How do you find the interquartile range?
We can find the interquartile range or IQR in four simple steps:
- Order the data from least to greatest
- Find the median
- Calculate the median of both the lower and upper half of the data
- The IQR is the difference between the upper and lower medians
Step 1: Order the data
In order to calculate the IQR, we need to begin by ordering the values of the data set from the least to the greatest. Likewise, in order to calculate the median, we need to arrange the numbers in ascending order (i.e. from the least to the greatest).
Let's sort an example data set with an odd number of values into ascending order.
Now, let's perform this task with another example data set that is comprised of an even number of values.
Rearrange into ascending order.
Step 2: Calculate the median
Next, we need to calculate the median. The median is the "center" of the data. If the data set has an odd number of data points, then the mean is the centermost number. On the other hand, if the data set has an even number of values, then we will need to take the arithmetic average of the two centermost values. We will calculate this average by adding the two numbers together and then dividing that number by two.
First, we will find the median of a set with an odd number of values. Cross out values until you find the centermost point
The median of the odd valued data set is four.
Now, let's find the mean of the data set with an even number of values. Cross out values until you find the two centermost points and then calculate the average the two values.
Find the average of the two centermost values.
The median of the even valued set is four.
Step 3: Upper and lower medians
Once we have found the median of the entire set, we can find the medians of the upper and lower portions of the data. If the data set has an odd number of values, we will omit the median or centermost value of the set. Afterwards, we will find the individual medians for the upper and lower portions of the data.
Omit the centermost value.
Find the median of the lower portion.
Calculate the average of the two values.
The median of the lower portion is
Find the median of the upper portion.
Calculate the average of the two values.
The median of the upper potion is
If the data set has an even number of values, we will use the two values used to calculate the original median to divide the data set. These values are not omitted and become the largest value of the lower data set and the lowest values of the upper data set, respectively. Afterwards, we will calculate the medians of both the upper and lower portions.
Find the median of the lower portion.
The median of the lower portion is two.
Find the median of the upper portion.
The median of the upper portion is eight.
Step 4: Calculate the difference
Last, we need to calculate the difference of the upper and lower medians by subtracting the lower median from the upper median. This value equals the IQR.
Let's find the IQR of the odd data set.
Finally, we will find the IQR of the even data set.
In order to better illustrate these values, their positions in a box plot have been labeled in the provided image.
Now that we have solved a few examples, let's use this knowledge to solve the given problem.
Solution:
To find interquartile range, you must find the range between the first and third quartiles. To do this, you must find the median value in the set of numbers to the left and right of the median. Thus, our first quartile is at 


Example Question #801 : Sat Subject Test In Math I
Find the interquartile range of the following data set:


How do you find the interquartile range?
We can find the interquartile range or IQR in four simple steps:
- Order the data from least to greatest
- Find the median
- Calculate the median of both the lower and upper half of the data
- The IQR is the difference between the upper and lower medians
Step 1: Order the data
In order to calculate the IQR, we need to begin by ordering the values of the data set from the least to the greatest. Likewise, in order to calculate the median, we need to arrange the numbers in ascending order (i.e. from the least to the greatest).
Let's sort an example data set with an odd number of values into ascending order.
Now, let's perform this task with another example data set that is comprised of an even number of values.
Rearrange into ascending order.
Step 2: Calculate the median
Next, we need to calculate the median. The median is the "center" of the data. If the data set has an odd number of data points, then the mean is the centermost number. On the other hand, if the data set has an even number of values, then we will need to take the arithmetic average of the two centermost values. We will calculate this average by adding the two numbers together and then dividing that number by two.
First, we will find the median of a set with an odd number of values. Cross out values until you find the centermost point
The median of the odd valued data set is four.
Now, let's find the mean of the data set with an even number of values. Cross out values until you find the two centermost points and then calculate the average the two values.
Find the average of the two centermost values.
The median of the even valued set is four.
Step 3: Upper and lower medians
Once we have found the median of the entire set, we can find the medians of the upper and lower portions of the data. If the data set has an odd number of values, we will omit the median or centermost value of the set. Afterwards, we will find the individual medians for the upper and lower portions of the data.
Omit the centermost value.
Find the median of the lower portion.
Calculate the average of the two values.
The median of the lower portion is
Find the median of the upper portion.
Calculate the average of the two values.
The median of the upper potion is
If the data set has an even number of values, we will use the two values used to calculate the original median to divide the data set. These values are not omitted and become the largest value of the lower data set and the lowest values of the upper data set, respectively. Afterwards, we will calculate the medians of both the upper and lower portions.
Find the median of the lower portion.
The median of the lower portion is two.
Find the median of the upper portion.
The median of the upper portion is eight.
Step 4: Calculate the difference
Last, we need to calculate the difference of the upper and lower medians by subtracting the lower median from the upper median. This value equals the IQR.
Let's find the IQR of the odd data set.
Finally, we will find the IQR of the even data set.
In order to better illustrate these values, their positions in a box plot have been labeled in the provided image.
Now that we have solved a few examples, let's use this knowledge to solve the given problem.
Solution:
Find the median of the following data set:

Whenever we are working with a data set, it can be helpful to put the terms in order:

Now that our terms are in order, we can do all sorts of things with them.
In this case, we need the interquartile range. First let's find the median

In this case, we have an equal number of terms, so we need to find the average of the middle two.

So our median is 39
Next, we need to find the first and third quartiles. These are essentially the medians of each half of our data set.
First Quartile is easy. it is just 16 because our two middle values for the first half are 16:

Third Quartile

finally, our IQR is going to be the difference between our 1st and 3rd quartiles:

So our answer is 64
Example Question #802 : Sat Subject Test In Math I
Find the interquartile range of the following set of numbers:
1,1,3,7,7,8,9,12,15


How do you find the interquartile range?
We can find the interquartile range or IQR in four simple steps:
- Order the data from least to greatest
- Find the median
- Calculate the median of both the lower and upper half of the data
- The IQR is the difference between the upper and lower medians
Step 1: Order the data
In order to calculate the IQR, we need to begin by ordering the values of the data set from the least to the greatest. Likewise, in order to calculate the median, we need to arrange the numbers in ascending order (i.e. from the least to the greatest).
Let's sort an example data set with an odd number of values into ascending order.
Now, let's perform this task with another example data set that is comprised of an even number of values.
Rearrange into ascending order.
Step 2: Calculate the median
Next, we need to calculate the median. The median is the "center" of the data. If the data set has an odd number of data points, then the mean is the centermost number. On the other hand, if the data set has an even number of values, then we will need to take the arithmetic average of the two centermost values. We will calculate this average by adding the two numbers together and then dividing that number by two.
First, we will find the median of a set with an odd number of values. Cross out values until you find the centermost point
The median of the odd valued data set is four.
Now, let's find the mean of the data set with an even number of values. Cross out values until you find the two centermost points and then calculate the average the two values.
Find the average of the two centermost values.
The median of the even valued set is four.
Step 3: Upper and lower medians
Once we have found the median of the entire set, we can find the medians of the upper and lower portions of the data. If the data set has an odd number of values, we will omit the median or centermost value of the set. Afterwards, we will find the individual medians for the upper and lower portions of the data.
Omit the centermost value.
Find the median of the lower portion.
Calculate the average of the two values.
The median of the lower portion is
Find the median of the upper portion.
Calculate the average of the two values.
The median of the upper potion is
If the data set has an even number of values, we will use the two values used to calculate the original median to divide the data set. These values are not omitted and become the largest value of the lower data set and the lowest values of the upper data set, respectively. Afterwards, we will calculate the medians of both the upper and lower portions.
Find the median of the lower portion.
The median of the lower portion is two.
Find the median of the upper portion.
The median of the upper portion is eight.
Step 4: Calculate the difference
Last, we need to calculate the difference of the upper and lower medians by subtracting the lower median from the upper median. This value equals the IQR.
Let's find the IQR of the odd data set.
Finally, we will find the IQR of the even data set.
In order to better illustrate these values, their positions in a box plot have been labeled in the provided image.
Now that we have solved a few examples, let's use this knowledge to solve the given problem.
Solution:
To solve, simply find the difference of your first and third quartiles. To find this, you have to find the value half way between the beginning and your median and between you median and the last value. From a prior question we know that the medial is located 5 from either side. Thus, in the middle of 5 we have 3, so our two values are 3 from the beginning and 3 from the end.


Example Question #803 : Sat Subject Test In Math I
Given the data set:

Find the interquartile range.


How do you find the interquartile range?
We can find the interquartile range or IQR in four simple steps:
- Order the data from least to greatest
- Find the median
- Calculate the median of both the lower and upper half of the data
- The IQR is the difference between the upper and lower medians
Step 1: Order the data
In order to calculate the IQR, we need to begin by ordering the values of the data set from the least to the greatest. Likewise, in order to calculate the median, we need to arrange the numbers in ascending order (i.e. from the least to the greatest).
Let's sort an example data set with an odd number of values into ascending order.
Now, let's perform this task with another example data set that is comprised of an even number of values.
Rearrange into ascending order.
Step 2: Calculate the median
Next, we need to calculate the median. The median is the "center" of the data. If the data set has an odd number of data points, then the mean is the centermost number. On the other hand, if the data set has an even number of values, then we will need to take the arithmetic average of the two centermost values. We will calculate this average by adding the two numbers together and then dividing that number by two.
First, we will find the median of a set with an odd number of values. Cross out values until you find the centermost point
The median of the odd valued data set is four.
Now, let's find the mean of the data set with an even number of values. Cross out values until you find the two centermost points and then calculate the average the two values.
Find the average of the two centermost values.
The median of the even valued set is four.
Step 3: Upper and lower medians
Once we have found the median of the entire set, we can find the medians of the upper and lower portions of the data. If the data set has an odd number of values, we will omit the median or centermost value of the set. Afterwards, we will find the individual medians for the upper and lower portions of the data.
Omit the centermost value.
Find the median of the lower portion.
Calculate the average of the two values.
The median of the lower portion is
Find the median of the upper portion.
Calculate the average of the two values.
The median of the upper potion is
If the data set has an even number of values, we will use the two values used to calculate the original median to divide the data set. These values are not omitted and become the largest value of the lower data set and the lowest values of the upper data set, respectively. Afterwards, we will calculate the medians of both the upper and lower portions.
Find the median of the lower portion.
The median of the lower portion is two.
Find the median of the upper portion.
The median of the upper portion is eight.
Step 4: Calculate the difference
Last, we need to calculate the difference of the upper and lower medians by subtracting the lower median from the upper median. This value equals the IQR.
Let's find the IQR of the odd data set.
Finally, we will find the IQR of the even data set.
In order to better illustrate these values, their positions in a box plot have been labeled in the provided image.
Now that we have solved a few examples, let's use this knowledge to solve the given problem.
Solution:
To find the interquartile range,we must always begin by arranging the given data in ascending or descending order. Then we have to find 


First, we find 


Now 


The interquartile range 
(Note 


Certified Tutor

All SAT II Math I Resources

