SAT II Math I : Quartiles and Interquartile Range
Study concepts, example questions & explanations for SAT II Math I


All SAT II Math I Resources
Example Questions
Example Question #10 : How To Find Interquartile Range

Find the interquartile range of the data set above.


How do you find the interquartile range?
We can find the interquartile range or IQR in four simple steps:
- Order the data from least to greatest
- Find the median
- Calculate the median of both the lower and upper half of the data
- The IQR is the difference between the upper and lower medians
Step 1: Order the data
In order to calculate the IQR, we need to begin by ordering the values of the data set from the least to the greatest. Likewise, in order to calculate the median, we need to arrange the numbers in ascending order (i.e. from the least to the greatest).
Let's sort an example data set with an odd number of values into ascending order.

}: 2, 2, 3, 3, 4, 5, 6, 9, 11")
Now, let's perform this task with another example data set that is comprised of an even number of values.

Rearrange into ascending order.
}: 1, 2, 2, 3, 4, 4, 7, 8, 9, 11")
Step 2: Calculate the median
Next, we need to calculate the median. The median is the "center" of the data. If the data set has an odd number of data points, then the mean is the centermost number. On the other hand, if the data set has an even number of values, then we will need to take the arithmetic average of the two centermost values. We will calculate this average by adding the two numbers together and then dividing that number by two.
First, we will find the median of a set with an odd number of values. Cross out values until you find the centermost point

The median of the odd valued data set is four.
Now, let's find the mean of the data set with an even number of values. Cross out values until you find the two centermost points and then calculate the average the two values.

Find the average of the two centermost values.


The median of the even valued set is four.
Step 3: Upper and lower medians
Once we have found the median of the entire set, we can find the medians of the upper and lower portions of the data. If the data set has an odd number of values, we will omit the median or centermost value of the set. Afterwards, we will find the individual medians for the upper and lower portions of the data.

Omit the centermost value.

Find the median of the lower portion.

Calculate the average of the two values.


The median of the lower portion is

Find the median of the upper portion.

Calculate the average of the two values.


The median of the upper potion is

If the data set has an even number of values, we will use the two values used to calculate the original median to divide the data set. These values are not omitted and become the largest value of the lower data set and the lowest values of the upper data set, respectively. Afterwards, we will calculate the medians of both the upper and lower portions.

Find the median of the lower portion.

The median of the lower portion is two.
Find the median of the upper portion.

The median of the upper portion is eight.
Step 4: Calculate the difference
Last, we need to calculate the difference of the upper and lower medians by subtracting the lower median from the upper median. This value equals the IQR.
Let's find the IQR of the odd data set.


Finally, we will find the IQR of the even data set.


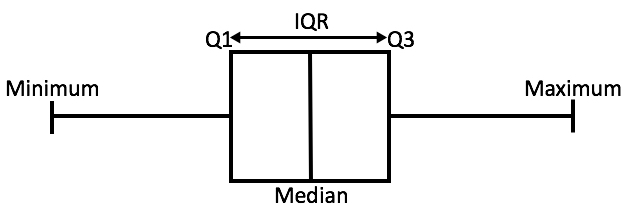
In order to better illustrate these values, their positions in a box plot have been labeled in the provided image.
Now that we have solved a few examples, let's use this knowledge to solve the given problem.
Solution:
When asked to find the IQR of a set of data, we must first put the numbers in numerical order:

Now we need to divide the data set into the upper quartile and lower quartile, we do so by finding the mean which is the center value of the data set.
In this data set, our median is 
This means that our upper quartile consists of 
So our 

Our 

Thus, our IQR is 
Example Question #11 : How To Find Interquartile Range

Find the interquartile range given the data set above.


How do you find the interquartile range?
We can find the interquartile range or IQR in four simple steps:
- Order the data from least to greatest
- Find the median
- Calculate the median of both the lower and upper half of the data
- The IQR is the difference between the upper and lower medians
Step 1: Order the data
In order to calculate the IQR, we need to begin by ordering the values of the data set from the least to the greatest. Likewise, in order to calculate the median, we need to arrange the numbers in ascending order (i.e. from the least to the greatest).
Let's sort an example data set with an odd number of values into ascending order.
Now, let's perform this task with another example data set that is comprised of an even number of values.
Rearrange into ascending order.
Step 2: Calculate the median
Next, we need to calculate the median. The median is the "center" of the data. If the data set has an odd number of data points, then the mean is the centermost number. On the other hand, if the data set has an even number of values, then we will need to take the arithmetic average of the two centermost values. We will calculate this average by adding the two numbers together and then dividing that number by two.
First, we will find the median of a set with an odd number of values. Cross out values until you find the centermost point
The median of the odd valued data set is four.
Now, let's find the mean of the data set with an even number of values. Cross out values until you find the two centermost points and then calculate the average the two values.
Find the average of the two centermost values.
The median of the even valued set is four.
Step 3: Upper and lower medians
Once we have found the median of the entire set, we can find the medians of the upper and lower portions of the data. If the data set has an odd number of values, we will omit the median or centermost value of the set. Afterwards, we will find the individual medians for the upper and lower portions of the data.
Omit the centermost value.
Find the median of the lower portion.
Calculate the average of the two values.
The median of the lower portion is
Find the median of the upper portion.
Calculate the average of the two values.
The median of the upper potion is
If the data set has an even number of values, we will use the two values used to calculate the original median to divide the data set. These values are not omitted and become the largest value of the lower data set and the lowest values of the upper data set, respectively. Afterwards, we will calculate the medians of both the upper and lower portions.
Find the median of the lower portion.
The median of the lower portion is two.
Find the median of the upper portion.
The median of the upper portion is eight.
Step 4: Calculate the difference
Last, we need to calculate the difference of the upper and lower medians by subtracting the lower median from the upper median. This value equals the IQR.
Let's find the IQR of the odd data set.
Finally, we will find the IQR of the even data set.
In order to better illustrate these values, their positions in a box plot have been labeled in the provided image.
Now that we have solved a few examples, let's use this knowledge to solve the given problem.
Solution:
When asked to find the IQR of a set of data, we must first put the numbers in numerical order:

Now we need to divide the data set into the upper quartile and lower quartile, we do so by finding the median which is the center value of the data set.
In this data set, our median is 
This means that our upper quartile consists of 
So our 

Our 

Thus, our IQR is 
Example Question #11 : How To Find Interquartile Range

Using the data set above, find the interquartile range.


How do you find the interquartile range?
We can find the interquartile range or IQR in four simple steps:
- Order the data from least to greatest
- Find the median
- Calculate the median of both the lower and upper half of the data
- The IQR is the difference between the upper and lower medians
Step 1: Order the data
In order to calculate the IQR, we need to begin by ordering the values of the data set from the least to the greatest. Likewise, in order to calculate the median, we need to arrange the numbers in ascending order (i.e. from the least to the greatest).
Let's sort an example data set with an odd number of values into ascending order.
Now, let's perform this task with another example data set that is comprised of an even number of values.
Rearrange into ascending order.
Step 2: Calculate the median
Next, we need to calculate the median. The median is the "center" of the data. If the data set has an odd number of data points, then the mean is the centermost number. On the other hand, if the data set has an even number of values, then we will need to take the arithmetic average of the two centermost values. We will calculate this average by adding the two numbers together and then dividing that number by two.
First, we will find the median of a set with an odd number of values. Cross out values until you find the centermost point
The median of the odd valued data set is four.
Now, let's find the mean of the data set with an even number of values. Cross out values until you find the two centermost points and then calculate the average the two values.
Find the average of the two centermost values.
The median of the even valued set is four.
Step 3: Upper and lower medians
Once we have found the median of the entire set, we can find the medians of the upper and lower portions of the data. If the data set has an odd number of values, we will omit the median or centermost value of the set. Afterwards, we will find the individual medians for the upper and lower portions of the data.
Omit the centermost value.
Find the median of the lower portion.
Calculate the average of the two values.
The median of the lower portion is
Find the median of the upper portion.
Calculate the average of the two values.
The median of the upper potion is
If the data set has an even number of values, we will use the two values used to calculate the original median to divide the data set. These values are not omitted and become the largest value of the lower data set and the lowest values of the upper data set, respectively. Afterwards, we will calculate the medians of both the upper and lower portions.
Find the median of the lower portion.
The median of the lower portion is two.
Find the median of the upper portion.
The median of the upper portion is eight.
Step 4: Calculate the difference
Last, we need to calculate the difference of the upper and lower medians by subtracting the lower median from the upper median. This value equals the IQR.
Let's find the IQR of the odd data set.
Finally, we will find the IQR of the even data set.
In order to better illustrate these values, their positions in a box plot have been labeled in the provided image.
Now that we have solved a few examples, let's use this knowledge to solve the given problem.
Solution:
When asked to find the IQR of a set of data, we must first put the numbers in numerical order:

Now we need to divide the data set into the upper quartile and lower quartile, we do so by finding the median which is the center value of the data set.
In this data set, our median is 
This means that our upper quartile consists of 
So our 

Our 

Thus, our IQR is 
Example Question #13 : Quartiles And Interquartile Range
Given the following data, find the range, mode, and mean:


Luckily, we are provided with a data set that is already in numerical order:

To find the range, we subtract the lowest value from the highest,

To find the mean, we add all of the data pieces and divide by the number of data pieces,

To find the mode, we search for numbers tha appear more than once. Since none of these data values appear more than once, we have no mode.
Example Question #14 : Quartiles And Interquartile Range
Provided with the following information, find the IQR and state the median.


How do you find the interquartile range?
We can find the interquartile range or IQR in four simple steps:
- Order the data from least to greatest
- Find the median
- Calculate the median of both the lower and upper half of the data
- The IQR is the difference between the upper and lower medians
Step 1: Order the data
In order to calculate the IQR, we need to begin by ordering the values of the data set from the least to the greatest. Likewise, in order to calculate the median, we need to arrange the numbers in ascending order (i.e. from the least to the greatest).
Let's sort an example data set with an odd number of values into ascending order.
Now, let's perform this task with another example data set that is comprised of an even number of values.
Rearrange into ascending order.
Step 2: Calculate the median
Next, we need to calculate the median. The median is the "center" of the data. If the data set has an odd number of data points, then the mean is the centermost number. On the other hand, if the data set has an even number of values, then we will need to take the arithmetic average of the two centermost values. We will calculate this average by adding the two numbers together and then dividing that number by two.
First, we will find the median of a set with an odd number of values. Cross out values until you find the centermost point
The median of the odd valued data set is four.
Now, let's find the mean of the data set with an even number of values. Cross out values until you find the two centermost points and then calculate the average the two values.
Find the average of the two centermost values.
The median of the even valued set is four.
Step 3: Upper and lower medians
Once we have found the median of the entire set, we can find the medians of the upper and lower portions of the data. If the data set has an odd number of values, we will omit the median or centermost value of the set. Afterwards, we will find the individual medians for the upper and lower portions of the data.
Omit the centermost value.
Find the median of the lower portion.
Calculate the average of the two values.
The median of the lower portion is
Find the median of the upper portion.
Calculate the average of the two values.
The median of the upper potion is
If the data set has an even number of values, we will use the two values used to calculate the original median to divide the data set. These values are not omitted and become the largest value of the lower data set and the lowest values of the upper data set, respectively. Afterwards, we will calculate the medians of both the upper and lower portions.
Find the median of the lower portion.
The median of the lower portion is two.
Find the median of the upper portion.
The median of the upper portion is eight.
Step 4: Calculate the difference
Last, we need to calculate the difference of the upper and lower medians by subtracting the lower median from the upper median. This value equals the IQR.
Let's find the IQR of the odd data set.
Finally, we will find the IQR of the even data set.
In order to better illustrate these values, their positions in a box plot have been labeled in the provided image.
Now that we have solved a few examples, let's use this knowledge to solve the given problem.
Solution:
This question provides us with all of the data necessary to answer its question, therefore no calculations are necessary.
To find the IQR, we simply use the formula 

The median is the 

Example Question #15 : Quartiles And Interquartile Range
If the 


How do you find the interquartile range?
We can find the interquartile range or IQR in four simple steps:
- Order the data from least to greatest
- Find the median
- Calculate the median of both the lower and upper half of the data
- The IQR is the difference between the upper and lower medians
Step 1: Order the data
In order to calculate the IQR, we need to begin by ordering the values of the data set from the least to the greatest. Likewise, in order to calculate the median, we need to arrange the numbers in ascending order (i.e. from the least to the greatest).
Let's sort an example data set with an odd number of values into ascending order.
Now, let's perform this task with another example data set that is comprised of an even number of values.
Rearrange into ascending order.
Step 2: Calculate the median
Next, we need to calculate the median. The median is the "center" of the data. If the data set has an odd number of data points, then the mean is the centermost number. On the other hand, if the data set has an even number of values, then we will need to take the arithmetic average of the two centermost values. We will calculate this average by adding the two numbers together and then dividing that number by two.
First, we will find the median of a set with an odd number of values. Cross out values until you find the centermost point
The median of the odd valued data set is four.
Now, let's find the mean of the data set with an even number of values. Cross out values until you find the two centermost points and then calculate the average the two values.
Find the average of the two centermost values.
The median of the even valued set is four.
Step 3: Upper and lower medians
Once we have found the median of the entire set, we can find the medians of the upper and lower portions of the data. If the data set has an odd number of values, we will omit the median or centermost value of the set. Afterwards, we will find the individual medians for the upper and lower portions of the data.
Omit the centermost value.
Find the median of the lower portion.
Calculate the average of the two values.
The median of the lower portion is
Find the median of the upper portion.
Calculate the average of the two values.
The median of the upper potion is
If the data set has an even number of values, we will use the two values used to calculate the original median to divide the data set. These values are not omitted and become the largest value of the lower data set and the lowest values of the upper data set, respectively. Afterwards, we will calculate the medians of both the upper and lower portions.
Find the median of the lower portion.
The median of the lower portion is two.
Find the median of the upper portion.
The median of the upper portion is eight.
Step 4: Calculate the difference
Last, we need to calculate the difference of the upper and lower medians by subtracting the lower median from the upper median. This value equals the IQR.
Let's find the IQR of the odd data set.
Finally, we will find the IQR of the even data set.
In order to better illustrate these values, their positions in a box plot have been labeled in the provided image.
Now that we have solved a few examples, let's use this knowledge to solve the given problem.
Solution:
Since the 

When we solve for 

This means that the median of the upper quartile of the set of data that this is for must be 
The median for the lower quartile must be 
Example Question #11 : How To Find Interquartile Range

Using the data provided, find the interquartile range.


How do you find the interquartile range?
We can find the interquartile range or IQR in four simple steps:
- Order the data from least to greatest
- Find the median
- Calculate the median of both the lower and upper half of the data
- The IQR is the difference between the upper and lower medians
Step 1: Order the data
In order to calculate the IQR, we need to begin by ordering the values of the data set from the least to the greatest. Likewise, in order to calculate the median, we need to arrange the numbers in ascending order (i.e. from the least to the greatest).
Let's sort an example data set with an odd number of values into ascending order.
Now, let's perform this task with another example data set that is comprised of an even number of values.
Rearrange into ascending order.
Step 2: Calculate the median
Next, we need to calculate the median. The median is the "center" of the data. If the data set has an odd number of data points, then the mean is the centermost number. On the other hand, if the data set has an even number of values, then we will need to take the arithmetic average of the two centermost values. We will calculate this average by adding the two numbers together and then dividing that number by two.
First, we will find the median of a set with an odd number of values. Cross out values until you find the centermost point
The median of the odd valued data set is four.
Now, let's find the mean of the data set with an even number of values. Cross out values until you find the two centermost points and then calculate the average the two values.
Find the average of the two centermost values.
The median of the even valued set is four.
Step 3: Upper and lower medians
Once we have found the median of the entire set, we can find the medians of the upper and lower portions of the data. If the data set has an odd number of values, we will omit the median or centermost value of the set. Afterwards, we will find the individual medians for the upper and lower portions of the data.
Omit the centermost value.
Find the median of the lower portion.
Calculate the average of the two values.
The median of the lower portion is
Find the median of the upper portion.
Calculate the average of the two values.
The median of the upper potion is
If the data set has an even number of values, we will use the two values used to calculate the original median to divide the data set. These values are not omitted and become the largest value of the lower data set and the lowest values of the upper data set, respectively. Afterwards, we will calculate the medians of both the upper and lower portions.
Find the median of the lower portion.
The median of the lower portion is two.
Find the median of the upper portion.
The median of the upper portion is eight.
Step 4: Calculate the difference
Last, we need to calculate the difference of the upper and lower medians by subtracting the lower median from the upper median. This value equals the IQR.
Let's find the IQR of the odd data set.
Finally, we will find the IQR of the even data set.
In order to better illustrate these values, their positions in a box plot have been labeled in the provided image.
Now that we have solved a few examples, let's use this knowledge to solve the given problem.
Solution:
Using the data provided:


Once we have the median divide the set into an upper quartile and lower quartile, we can use the same method to find the medians of those mini-groups, giving us an upper quartile median, 

The IQR is defined as

Example Question #131 : Data Analysis And Statistics
Find the interquartile range.


How do you find the interquartile range?
We can find the interquartile range or IQR in four simple steps:
- Order the data from least to greatest
- Find the median
- Calculate the median of both the lower and upper half of the data
- The IQR is the difference between the upper and lower medians
Step 1: Order the data
In order to calculate the IQR, we need to begin by ordering the values of the data set from the least to the greatest. Likewise, in order to calculate the median, we need to arrange the numbers in ascending order (i.e. from the least to the greatest).
Let's sort an example data set with an odd number of values into ascending order.
Now, let's perform this task with another example data set that is comprised of an even number of values.
Rearrange into ascending order.
Step 2: Calculate the median
Next, we need to calculate the median. The median is the "center" of the data. If the data set has an odd number of data points, then the mean is the centermost number. On the other hand, if the data set has an even number of values, then we will need to take the arithmetic average of the two centermost values. We will calculate this average by adding the two numbers together and then dividing that number by two.
First, we will find the median of a set with an odd number of values. Cross out values until you find the centermost point
The median of the odd valued data set is four.
Now, let's find the mean of the data set with an even number of values. Cross out values until you find the two centermost points and then calculate the average the two values.
Find the average of the two centermost values.
The median of the even valued set is four.
Step 3: Upper and lower medians
Once we have found the median of the entire set, we can find the medians of the upper and lower portions of the data. If the data set has an odd number of values, we will omit the median or centermost value of the set. Afterwards, we will find the individual medians for the upper and lower portions of the data.
Omit the centermost value.
Find the median of the lower portion.
Calculate the average of the two values.
The median of the lower portion is
Find the median of the upper portion.
Calculate the average of the two values.
The median of the upper potion is
If the data set has an even number of values, we will use the two values used to calculate the original median to divide the data set. These values are not omitted and become the largest value of the lower data set and the lowest values of the upper data set, respectively. Afterwards, we will calculate the medians of both the upper and lower portions.
Find the median of the lower portion.
The median of the lower portion is two.
Find the median of the upper portion.
The median of the upper portion is eight.
Step 4: Calculate the difference
Last, we need to calculate the difference of the upper and lower medians by subtracting the lower median from the upper median. This value equals the IQR.
Let's find the IQR of the odd data set.
Finally, we will find the IQR of the even data set.
In order to better illustrate these values, their positions in a box plot have been labeled in the provided image.
Now that we have solved a few examples, let's use this knowledge to solve the given problem.
Solution:
To find the interquartile range, we need to find the upper and lower quartiles and take the difference. First, let's find the median or 


Example Question #18 : Quartiles And Interquartile Range
Find the interquartile range.


How do you find the interquartile range?
We can find the interquartile range or IQR in four simple steps:
- Order the data from least to greatest
- Find the median
- Calculate the median of both the lower and upper half of the data
- The IQR is the difference between the upper and lower medians
Step 1: Order the data
In order to calculate the IQR, we need to begin by ordering the values of the data set from the least to the greatest. Likewise, in order to calculate the median, we need to arrange the numbers in ascending order (i.e. from the least to the greatest).
Let's sort an example data set with an odd number of values into ascending order.
Now, let's perform this task with another example data set that is comprised of an even number of values.
Rearrange into ascending order.
Step 2: Calculate the median
Next, we need to calculate the median. The median is the "center" of the data. If the data set has an odd number of data points, then the mean is the centermost number. On the other hand, if the data set has an even number of values, then we will need to take the arithmetic average of the two centermost values. We will calculate this average by adding the two numbers together and then dividing that number by two.
First, we will find the median of a set with an odd number of values. Cross out values until you find the centermost point
The median of the odd valued data set is four.
Now, let's find the mean of the data set with an even number of values. Cross out values until you find the two centermost points and then calculate the average the two values.
Find the average of the two centermost values.
The median of the even valued set is four.
Step 3: Upper and lower medians
Once we have found the median of the entire set, we can find the medians of the upper and lower portions of the data. If the data set has an odd number of values, we will omit the median or centermost value of the set. Afterwards, we will find the individual medians for the upper and lower portions of the data.
Omit the centermost value.
Find the median of the lower portion.
Calculate the average of the two values.
The median of the lower portion is
Find the median of the upper portion.
Calculate the average of the two values.
The median of the upper potion is
If the data set has an even number of values, we will use the two values used to calculate the original median to divide the data set. These values are not omitted and become the largest value of the lower data set and the lowest values of the upper data set, respectively. Afterwards, we will calculate the medians of both the upper and lower portions.
Find the median of the lower portion.
The median of the lower portion is two.
Find the median of the upper portion.
The median of the upper portion is eight.
Step 4: Calculate the difference
Last, we need to calculate the difference of the upper and lower medians by subtracting the lower median from the upper median. This value equals the IQR.
Let's find the IQR of the odd data set.
Finally, we will find the IQR of the even data set.
In order to better illustrate these values, their positions in a box plot have been labeled in the provided image.
Now that we have solved a few examples, let's use this knowledge to solve the given problem.
Solution:
To find the interquartile range, we need to find the upper and lower quartiles and take the difference. First, let's find the median or 


Example Question #19 : Quartiles And Interquartile Range
Find the interquartile range of the following set of numbers:


How do you find the interquartile range?
We can find the interquartile range or IQR in four simple steps:
- Order the data from least to greatest
- Find the median
- Calculate the median of both the lower and upper half of the data
- The IQR is the difference between the upper and lower medians
Step 1: Order the data
In order to calculate the IQR, we need to begin by ordering the values of the data set from the least to the greatest. Likewise, in order to calculate the median, we need to arrange the numbers in ascending order (i.e. from the least to the greatest).
Let's sort an example data set with an odd number of values into ascending order.
Now, let's perform this task with another example data set that is comprised of an even number of values.
Rearrange into ascending order.
Step 2: Calculate the median
Next, we need to calculate the median. The median is the "center" of the data. If the data set has an odd number of data points, then the mean is the centermost number. On the other hand, if the data set has an even number of values, then we will need to take the arithmetic average of the two centermost values. We will calculate this average by adding the two numbers together and then dividing that number by two.
First, we will find the median of a set with an odd number of values. Cross out values until you find the centermost point
The median of the odd valued data set is four.
Now, let's find the mean of the data set with an even number of values. Cross out values until you find the two centermost points and then calculate the average the two values.
Find the average of the two centermost values.
The median of the even valued set is four.
Step 3: Upper and lower medians
Once we have found the median of the entire set, we can find the medians of the upper and lower portions of the data. If the data set has an odd number of values, we will omit the median or centermost value of the set. Afterwards, we will find the individual medians for the upper and lower portions of the data.
Omit the centermost value.
Find the median of the lower portion.
Calculate the average of the two values.
The median of the lower portion is
Find the median of the upper portion.
Calculate the average of the two values.
The median of the upper potion is
If the data set has an even number of values, we will use the two values used to calculate the original median to divide the data set. These values are not omitted and become the largest value of the lower data set and the lowest values of the upper data set, respectively. Afterwards, we will calculate the medians of both the upper and lower portions.
Find the median of the lower portion.
The median of the lower portion is two.
Find the median of the upper portion.
The median of the upper portion is eight.
Step 4: Calculate the difference
Last, we need to calculate the difference of the upper and lower medians by subtracting the lower median from the upper median. This value equals the IQR.
Let's find the IQR of the odd data set.
Finally, we will find the IQR of the even data set.
In order to better illustrate these values, their positions in a box plot have been labeled in the provided image.
Now that we have solved a few examples, let's use this knowledge to solve the given problem.
Solution:
To find quartile range, you first need to isolate the numbers that are the book ends of your first and 3rd quartiles. To do this, find the middlenumber between the min and mean, and subtract this from the middle number between the mean and the max number. Thus,


Certified Tutor

Certified Tutor

All SAT II Math I Resources

