New SAT Math - Calculator : New SAT Math - Calculator
Study concepts, example questions & explanations for New SAT Math - Calculator


All New SAT Math - Calculator Resources
Example Questions
Example Question #11 : New Sat Math Calculator
Given the inequality above, which of the following MUST be true?


Subtract 7 from both sides:


Divide both sides by 

Remember to switch the inequality when dividing by a negative number:

Since 


Example Question #12 : New Sat Math Calculator
The histogram depicts the number of errors students missed on last week's homework assignment. Estimate the mean number of errors made.


To estimate the mean number of errors made, first calculate the mean of each bar in the histogram.
Recall to calculate a mean of a histogram bar use the formula:

The red bar's mean:

The yellow bar's mean:

The green bar's mean:

The teal bar's mean:

The blue bar's mean:

The purple bar's mean:

Now to estimate the mean of the number of errors, add the means of the bars together and divide by the total number of frequencies.

Example Question #3221 : Sat Mathematics
Mrs. Smith assigns homework to her class once a week and records each student's results. For last week's assignment, the histogram depicts these results. If the homework set was worth twenty points, what is the range of grades for last week's assignment?
Note: For each error, one point is subtracted from the total points possible.
To solve this problem, first identify what the highest and lowest grade on the assignment was. The highest grade will be the one with the least amount of errors made and the lowest grade will be the one with the most amount of errors made.
The red bar in the histogram says that students made between zero and two errors. In other words, either: 0, 1, 2 errors.
The yellow bar in the histogram says that the students made between two and four errors. Since the red bar includes two errors the yellow bar only includes 3 or 4 errors.
The green bar in the histogram says that students made 5 or 6 errors.
The teal bar in the histogram says that students made 7 or 8 errors.
The blue bar in the histogram says that students made 9 or 10 errors.
The purple bar in the histogram says that students made 11 or 12 errors.
This means that at least one student made zero errors on the assignment and therefore did not loose any points. Therefore, the highest grade on the assignment was twenty.
The histogram shows that at least one student made twelve errors on the test. Therefore, the lowest grade on the assignment would be:

From here, calculate the range.

Example Question #665 : Psat Mathematics
How many negative solutions are there to the equation below?


First, subtract 3 from both sides in order to obtain an equation that equals 0:

The left side can be factored. We need factors of 


(x+3) = 0")
Set both factors equal to 0 and solve:

To solve the left equation, add 1 to both sides. To solve the right equation, subtract 3 from both sides. This yields two solutions:

Only one of these solutions is negative, so the answer is 1.
Example Question #73 : Systems Of Equations
Which of the following graphs correctly represents the quadratic inequality below (solutions to the inequalities are shaded in blue)?
^2")


To begin, we analyze the equation given: the base equation, 
^2")

To solve the inequality, we need to take a test point and plug it in to see if it matches the inequality. The only points that cannot be used are those directly on our parabola, so let's use the origin ")
^2")
Simplified as:

Which is not true, so the area inside of the parabola should be shaded, resulting in the following graph:
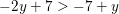
Example Question #13 : New Sat Math Calculator
What is the 


This question tests one's ability to recognize algebraic characteristics of a graph. This particular question examines a linear function.
Knowing the standard and the concept for which it relates to, we can now do the step-by-step process to solve the problem in question.
Step 1: Identify the general algebraic function for the given graph.
Since the graph is that of a straight line, the general algebraic form of the function is,

where

Step 2: Identify where the graph crosses the 
Therefore the general form of the function looks like,

Step 3: Answer the question.
The 
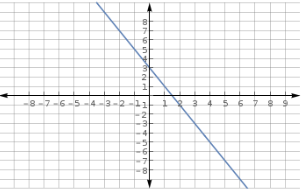
Example Question #14 : New Sat Math Calculator
What is the slope of the line depicted by the graph?


Looking at the graph, it is seen that the line passes through the points (-8,-5) and (8,5).
The slope of a line through the points ")
")

in the slope formula:
}{8 - (-8)} = \frac{5+5}{8 + 8} = \frac{10}{16} = \frac{5}{8}")
Example Question #11 : How To Find Out If A Point Is On A Line With An Equation


The table and graph describe two different particle's travel over time. Which particle has a lower minimum?


This question is testing one's ability to compare the properties of functions when they are illustrated in different forms. This question specifically is asking for the examination and interpretation of two quadratic functions for which one is illustrated in a table format and the other is illustrated graphically.
Step 1: Identify the minimum of the table.
Using the table find the time value where the lowest distance exists.

Recall that the time represents the 

")
Step 2: Identify the minimum of the graph
Recall that the minimum of a cubic function is known as a local minimum. This occurs at the valley where the vertex lies.
For this particular graph the vertex is at ")
Step 3: Compare the minimums from step 1 and step 2.
Compare the 

Therefore, the graph has the lowest minimum.
Example Question #233 : Algebra
If 


To solve this problem, add the two equations together:


The only answer choice that satisfies this equation is 0, because 0 is less than 4.
Example Question #32 : How To Find The Solution For A System Of Equations
An amusement park charges both an entrance fee, and a fee for every ride. This fee is the same for all rides. Lisa went on 6 rides and paid 120 dollars. Tom went on only 4 rides and paid 95 dollars. What was the entrance fee?


We need 2 equations, because we have 2 unkown variables. Let 


Apply similar logic to Tom:

Subtracting the second equation from the first equation results in:

Divide both sides by 2:

So every ride costs 12.5 dollars. Plugging 12.5 back into one of the original equations allows us to solve for the entrance fee:
 +e")

Subtract 50 from both sides:


All New SAT Math - Calculator Resources

