New SAT Math - Calculator : New SAT Math - Calculator
Study concepts, example questions & explanations for New SAT Math - Calculator


All New SAT Math - Calculator Resources
Example Questions
Example Question #1 : New Sat Math Calculator
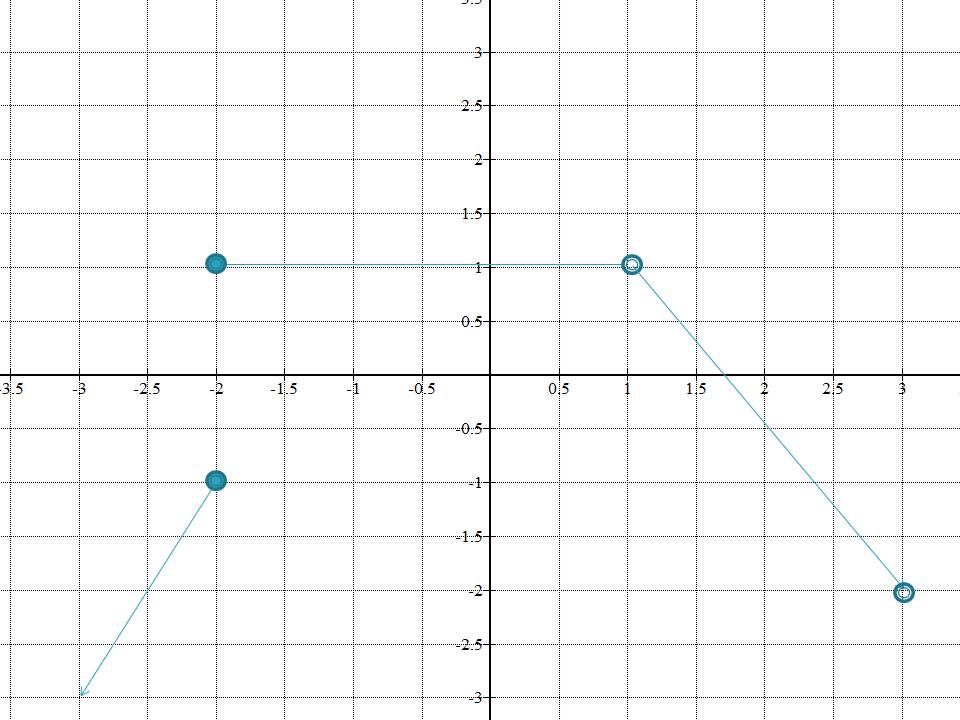
The graph below is the graph of a piece-wise function in some interval. Identify, in interval notation, the decreasing interval.
")
")
\cup \left ( 1,3\right]")
")
\cup (1,3)")
As is clear from the graph, in the interval between 


")


")
Example Question #2 : New Sat Math Calculator
If 


The formula for inverse variation is as follows:

Use the x and y values from the first part of the sentence to find k.


Then use that k value and the given x value to find y.


Example Question #3 : New Sat Math Calculator
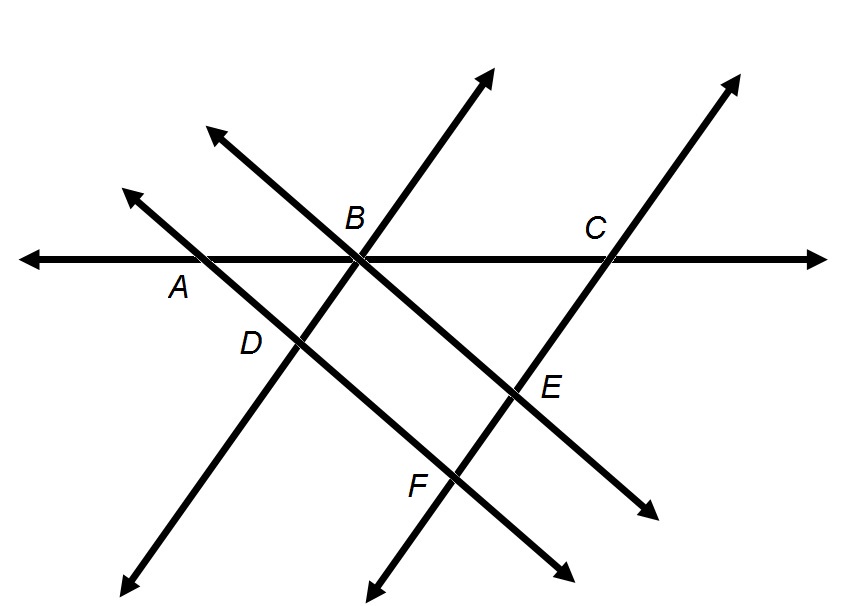
Refer to the above diagram:
True or false: 

True
False
False
A line can be named after any two points it passes through. The line 
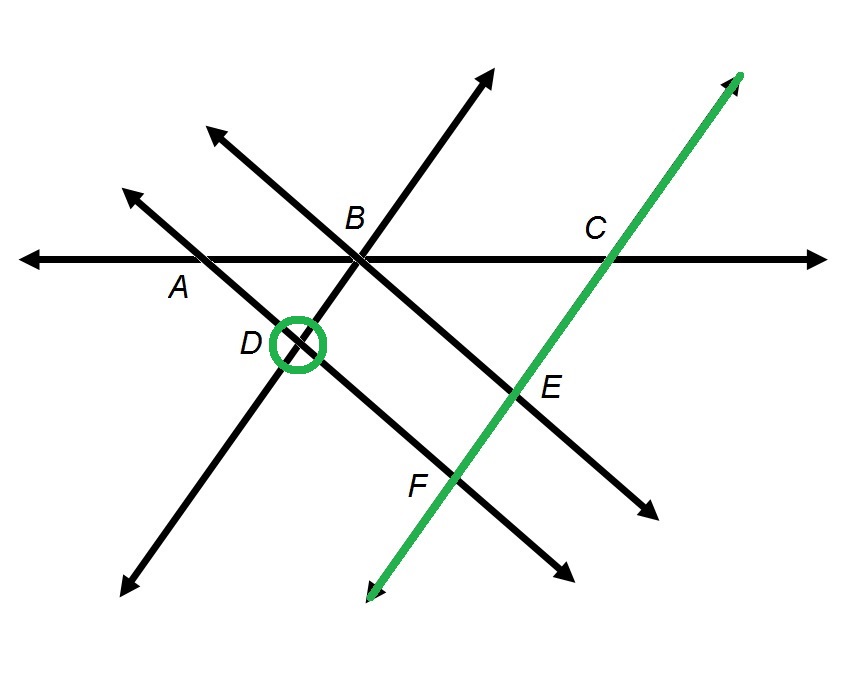
The line does not pass through 


Example Question #4 : New Sat Math Calculator
Sally sells custom picture frames. Her monthly fixed costs are $350. It costs $10 to make each frame. Sally sells her picture frames for $35 each.
How many picture frames must Sally sell in order to break even?


The break-even point is where the costs equal the revenues.
Let 
Costs:
 = 10x +350")
Revenues:
 = 35x")
Thus,

So 14 picture frames must be sold each month to break-even.
Example Question #5 : New Sat Math Calculator
Mrs. Smith's 8th grade class has a weekly quiz. The graph below depicts the number of questions students got incorrect on their quiz and their corresponding quiz grade. Examining the graph, what type of correlation if any, exists?

The graph depicts a negative correlation.
More information is needed.
The graph depicts a constant correlation.
The graph depicts no correlation.
The graph depicts a positive correlation.
The graph depicts a negative correlation.
Mrs. Smith's 8th grade class had a quiz last week. The graph below depicts the number of questions students got incorrect on their quiz and their corresponding quiz grade. In other words, the graph in this particular question is a dot plot and the question asks to find a correlation if one exists.
Recall that a correlation is a trend seen in the data. Graphically, trends can be either:
I. Positive
II. Negative
III. Constant
IV. No trend
For a trend to be positive the x and y variable both increase. A trend is negative when the y variable (dependent variable) decreases as the x variable (independent variable) increases. A constant trend occurs when the y variable stays the same as the x variable increases. No trend exists when the data appears to be scattered with no association between the x and y variables.
Examining the graph given it is seen that the x variable is the number of questions missed and the y variable is the overall score on the quiz. It is seen that as the number of questions missed increases, the overall score on the quiz decreases. This describes a negative trend.
In other words, the graph depicts a negative correlation.
Example Question #864 : Arithmetic
Convert three yards to inches.


To solve this problem, we need to know the conversions between yards to feet, and feet to inches. Write their correct conversions.


Convert three yards to feet.
= 9 \textup{ feet}")
Convert nine feet to inches.
= 108\textup{ inches}")
Example Question #6 : New Sat Math Calculator

Above is a graph which gives the high and low temperatures, in degrees Celsius, over a one week period for Washington City. Temperature given in degrees Celsius can be converted to the Fahrenheit scale using the following formula, where 


On how many days of the week shown on the graph did the temperature get above 
Four
Seven
Three
Five
Six
Three
Convert 


The question is therefore asking for the number of days that the temperature topped 

The high temperature was greater than 
Example Question #7 : New Sat Math Calculator
Define an operation 
For all real numbers 

Evaluate: ")


The expression is undefined.
None of the other responses is correct.


 \div ( | a |+ | b | )")
=\left ( \frac{4}{5}+1 \right ) \div \left (\left| \frac{4}{5} \right |+ \left |- \frac{4}{5}\right | \right )")
")


Example Question #8 : New Sat Math Calculator


Which of the following is a true statement?


Looking at the second statement, isolate x on one side with all other constants and variables on the other side.


Looking at the third statement, isolate z on one side with all other constants and variables on the other side.


Looking at the first statement, isolate y on one side with all other constants and variables on the other side.


From here, use these equivalencies so solve for y.
Substituting twice:

+ 2")

-8")

Example Question #9 : New Sat Math Calculator

Solve for 


Find all factors of 24
1, 2, 3,4, 6, 8, 12, 24
Now find two factors that add up to 


By factoring, you can set the equation to be
(x+3)=0")
If you FOIL it out, it gives you 
Set each part of the equation equal to 0, and solve for 


All New SAT Math - Calculator Resources

