MCAT Physical : Physical Chemistry
Study concepts, example questions & explanations for MCAT Physical


All MCAT Physical Resources
Example Questions
Example Question #3 : Phase Diagrams
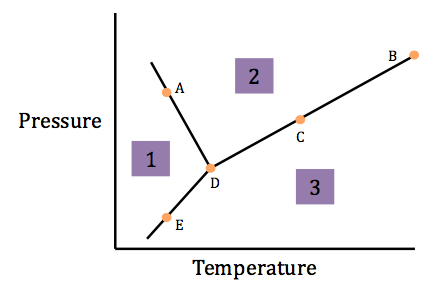
Phase diagrams are used to depict changes in the properties of a solution at different temperatures and pressures. Below is a phase diagram of a polar solution.
What processes are occurring at Point C?
Freezing/melting
Deposition/sublimation
Vaporization/condensation
None of these
Vaporization/condensation
First, it is important to identify what phases are occurring on each side of the line on which Point C rests. In section two, both the pressure and temperature are intermediate, meaning the solution is a liquid. In section three, both the pressure and temperature are high, meaning the solution is a gas. In other words, the segment that Point C is on is the equilibrium line between liquid and gas, thus, vaporization and condensation are occurring at Point C.
Example Question #1 : Phase Diagrams
Phase diagrams are used to depict changes in the properties of a solution at different temperatures and pressures. Below is a phase diagram of a polar solution.
What processes are occurring at Point E?
Vaporization/condensation
None of these
Deposition/sublimation
Freezing/melting
Deposition/sublimation
First, it is important to identify what phases are occurring on each side of the line on which Point E rests. In section 1, the pressure is high and the temperature low, meaning the solution is a solid. In section three, both the pressure and temperature are high, meaning the solution is a gas. In other words, the segment that Point E is on is the equilibrium line between solid and gas, thus, deposition and sublimation are occurring at Point E.
Example Question #1 : Phase Diagrams
Phase diagrams are used to depict changes in the properties of a solution at different temperatures and pressures. Below is a phase diagram of a polar solution.
What molecule has a phase diagram similar to the one presented?
Water
Mercury
Hydrogen
Bromine
Water
While this may seem like an obscure question, the MCAT specifically requires you to know the shape of the water phase diagram. Unique to only a few molecules, the solid phase in our diagram is less dense than the liquid phase, meaning that the solid/liquid phase line has a negative slope (this can be seen as segment AD in the above image). Water is one of the select few compounds with this characteristic.
Example Question #1161 : Mcat Physical Sciences
The phase diagram for water (H2O) shows that it can go through all three phases at a pressure of 1atm. The phase diagram for carbon dioxide (CO2) shows that it can only be a solid or a gas at 1atm.
Based on this information, which statement is true?
CO2 will not sublimate at a pressure of 1atm
CO2 does not have a liquid phase
Raising the pressure when CO2 is a solid will result in CO2 liquid
CO2 has a higher triple point pressure than H2O
CO2 has a higher triple point pressure than H2O
The phase diagram for carbon dioxide (CO2) shows that it will sublimate from a solid to a gas as temperature is increased at one atmosphere of pressure. If a solid immediately goes to a gas, we can conclude that the pressure is too low to allow the substance to first go through the liquid phase. As a result, we can conclude that the point in which CO2 is in all three phases (the triple point) will take place at a higher pressure than 1atm. Because water (H2O) is able to go through all of its three phases at a pressure of 1atm, we know that the triple point pressure is less than 1atm.
Example Question #1162 : Mcat Physical Sciences
Phase diagrams are used to depict changes in the properties of a solution at different temperatures and pressures. Below is a phase diagram of a polar solution.
What are the phases in sections 1, 2, and 3, respectively?
Solid, liquid, gas
Liquid, solid, gas
Solid, gas, liquid
Gas, solid, liquid
Solid, liquid, gas
Section 1 is at high pressure and low temperature, meaning the solution is a solid. In section 2, the solution is at intermediate pressure and temperature, meaning it is a liquid. Section 3 is at high temperature and low pressure, meaning it is a gas.
Example Question #1163 : Mcat Physical Sciences
A hockey player cannot skate on dry ice due to its __________.
positive slope of its solid-liquid equilibrium line
positive slope of its solid-gas equilibrium line
negative slope of its solid-liquid equilibrium line
negative slope of its solid-gas equilibrium line
positive slope of its solid-liquid equilibrium line
Because dry ice is frozen carbon dioxide, it does not have the same liquid-solid equilibrium line as water and traditional ice. Its liquid-solid equilibrium line is positive, which means that increased pressure will only cause the dry ice to remain solid. If it were negative, then increased pressure would cause melting as seen with water. Skating on solids is like skating on dirt or rocks. The other choices concerning solid and gas does not apply since no gases are involved.
Example Question #161 : Biochemistry, Organic Chemistry, And Other Concepts
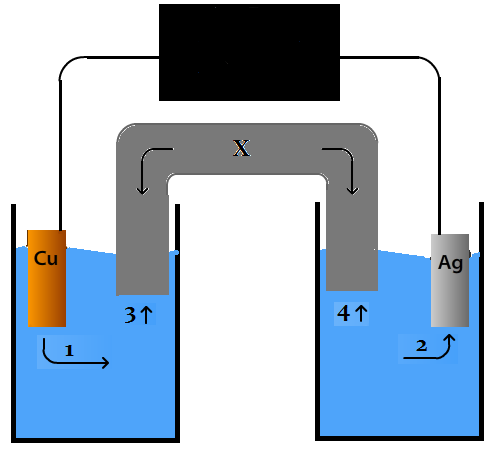
A student conducts an experiment for a chemistry class. The student wishes to explore power generation from different types of voltaic cells. He sets up three different cells, and then compares the amount of energy generated from each one.
One of his cells is shown below as an example. Both remaining cells follow the same layout.
Instead of silver, a scientist uses a strip of zinc in the opposite half cell from copper. Which of the following is true when comparing this new cell to the cell in the diagram?
The reduction potential of 

The direction of electron flow is the same in both cells
The cathode is the same in both cells
Energy can be produced in both cells
The direction of ion migration in the salt bridge is the same in both cells
Ions are no longer generated in the new cell
Energy can be produced in both cells
In the new cell, energy can still be produced, but because zinc ions have a lower reduction potential than copper ions, the copper will be reduced and the direction of electron flow will be reversed, as compared to the cell with silver in which copper was oxidized.
Example Question #1 : Electrochemistry
A student conducts an experiment for a chemistry class. The student wishes to explore power generation from different types of voltaic cells. He sets up three different cells, and then compares the amount of energy generated from each one.
One of his cells is shown below as an example. Both remaining cells follow the same layout.
If there is a net production of copper ions in the half cell on the left as the reaction proceeds, which of the following must be true?
Copper is reduced in the reaction
Silver has a more positive reduction potential than copper
Silver is oxidized in the reaction
Copper has a more positive reduction potential than silver
There is no net electron flow
Silver has a more positive reduction potential than copper
If copper ions are generated as the voltaic cell functions, then the copper is being oxidized, and the silver must be reduced. Reduction and oxidation always occur together in a coupled reaction. This must also mean that the reduction potential for Ag is higher than the reduction potential for Cu.
Example Question #151 : Physical Chemistry
A student conducts an experiment for a chemistry class. The student wishes to explore power generation from different types of voltaic cells. He sets up three different cells, and then compares the amount of energy generated from each one.
One of his cells is shown below as an example. Both remaining cells follow the same layout.
As the difference in the reduction potentials between two half cells increases, what happens to the Gibbs free energy of the reaction?
It becomes more positive
It only changes with changes in temperature or pressure, and is independent of the chemical species involved
It does not change, as thermodynamics is independent of reduction potential
It will increase or decrease, depending on the species involved
It becomes more negative
It becomes more negative
The reduction potential of a cell is directly related to the Gibbs free energy by the equation below.

As the reduction potential of a cell becomes more and more positive, the Gibbs free energy value becomes more and more negative.
Example Question #2 : Electrochemistry
Imagine a galvanic cell which uses solid zinc and aqueous iron ions to produce a voltage.
 + Fe^{2+}(aq)\rightarrow Zn^{2+}(aq) + Fe(s)")


What is the standard state cell potential for this reaction?


Keep in mind that a galvanic cell will always have a positive voltage, so you can disregard the negative options. The half reactions show the voltage that will result if the element in question is reduced; however, an oxidation-reduction reaction will always have one element oxidized and another element reduced. In the equation shown, solid zinc (Zn) is oxidized, so the voltage of its half reaction is inverted to +0.76V. Next, you add the voltage of iron's reduction, resulting in the overall voltage of the galvanic cell.
 = 0.32V")


All MCAT Physical Resources

