MCAT Physical : Phase Diagrams
Study concepts, example questions & explanations for MCAT Physical


All MCAT Physical Resources
Example Questions
Example Question #1 : Phase Diagrams
A scientist prepares an experiment to demonstrate the second law of thermodynamics for a chemistry class. In order to conduct the experiment, the scientist brings the class outside in January and gathers a cup of water and a portable stove.
The temperature outside is –10 degrees Celsius. The scientist asks the students to consider the following when answering his questions:
Gibbs Free Energy Formula:
ΔG = ΔH – TΔS
Liquid-Solid Water Phase Change Reaction:
H2O(l) ⇌ H2O(s) + X
The scientist prepares two scenarios.
Scenario 1:
The scientist buries the cup of water outside in the snow, returns to the classroom with his class for one hour, and the class then checks on the cup. They find that the water has frozen in the cup.
Scenario 2:
The scientist then places the frozen cup of water on the stove and starts the gas. The class finds that the water melts quickly.
After the water melts, the scientist asks the students to consider two hypothetical scenarios as a thought experiment.
Scenario 3:
Once the liquid water at the end of scenario 2 melts completely, the scientist turns off the gas and monitors what happens to the water. Despite being in the cold air, the water never freezes.
Scenario 4:
The scientist takes the frozen water from the end of scenario 1, puts it on the active stove, and the water remains frozen.
Which of the following best describes the Liquid-Solid Water Phase Change Reaction above?
Aqueous redox reaction
Chemical reaction
Both a chemical and physical reaction
Both an aqueous redox and physical reaction
Physical reaction
Physical reaction
This is an example of a phase change physical reaction at the liquid-solid interface. There is no change in the organization of chemical bonds; therefore, it is not an example of a chemical reaction. There is also no change in the bonding partners of the constituent oxygen and hydrogen atoms of water. As a result, there is no change in oxidation numbers. Without a change in oxidation number values, it is not a redox reaction.
Example Question #2 : Phase Diagrams
Which best describes the significance of a "critical point" on a phase diagram?
The lowest temperature and pressure at which a substance may exist in a gaseous phase
The temperature and pressure at which a substance may exist in equilbrium between the solid, liquid, and gas phases
The highest temperature and pressure at which a substance may exist in distinct solid and liquid phases
The lowest temperature and pressure at which a substance may exist in a liquid phase
The highest temperature and pressure at which a substance may exist in distinct liquid and gas phases
The highest temperature and pressure at which a substance may exist in distinct liquid and gas phases
The critical point is defined by the highest temperature and highest pressure at which a substance exists in distinct liquid and gas phases. Beyond this point, there is no distinction between the liquid and gaseous phases.
The temperature and pressure at which a substance may exist in equilibrium between the solid, liquid, and gas phases is known as the triple-point.
Example Question #3 : Phase Diagrams
Phase diagrams are used to depict changes in the properties of a solution at different temperatures and pressures. Below is a phase diagram of a polar solution.
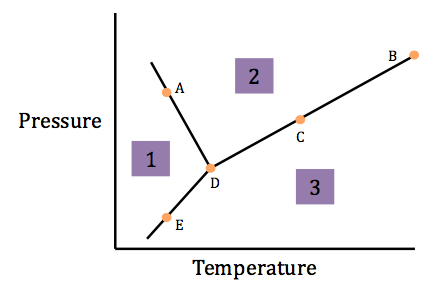
What is the name of Point D?
Boiling point
Freezing point
Critical point
Triple point
Triple point
Point D occurs at the intersection of the three segments, and is called the triple point. All three phases (solid, liquid, and gas) co-exist at the triple point.
Point B corresponds to the critical point. The freezing and boiling points are dependent on pressure, and are depicted as the lines between regions 1 and 2 (freezing) and between regions 2 and 3 (boiling).
Example Question #4 : Phase Diagrams
Phase diagrams are used to depict changes in the properties of a solution at different temperatures and pressures. Below is a phase diagram of a polar solution.
What processes are occurring at Point D?
Condensation (and vaporization)
Freezing (and melting)
Deposition (and sublimation)
All of the above
All of the above
Point D is called the triple point. At the triple point, all three phases (solid, liquid, and gas) co-exist. The processes that are occurring are condensation and vaporization, sublimation and deposition, and freezing and melting.
Condensation and vaporization allow liquid and gas to co-exist. Sublimation and deposition allow solid and gas to co-exist. Freezing and melting allow solid and liquid to co-exist. In these terms, it makes sense that all six processes occur at the triple point.
Example Question #1 : Phase Diagrams
Phase diagrams are used to depict changes in the properties of a solution at different temperatures and pressures. Below is a phase diagram of a polar solution.
What is the name of Point B?
Critical point
Freezing point
Triple point
Melting point
Critical point
Point B occurs at the highest pressure and temperature point on the phase diagram. This point is called the critical point, meaning that at temperatures and pressures beyond this point separate gas and liquid phases do not exist.
Example Question #141 : Physical Chemistry
Phase diagrams are used to depict changes in the properties of a solution at different temperatures and pressures. Below is a phase diagram of a polar solution.
At temperatures and pressures above those at Point B, the material is called a __________.
Liquid
Plasma
Gas
Supercritical fluid
Supercritical fluid
Point B is known as the critical point. While identifying this point on the phase diagram is important, it is also important to know that at temperatures and pressures above the critical point, the solution is called a supercritical fluid, meaning that separate gas and liquid phases do not exist.
Example Question #142 : Physical Chemistry
Phase diagrams are used to depict changes in the properties of a solution at different temperatures and pressures. Below is a phase diagram of a polar solution.
What processes are occurring at Point A?
None of these
Deposition/sublimation
Condensation/vaporization
Freezing/melting
Freezing/melting
First, it is important to identify what phases are occurring on each side of the line on which Point A rests. In section 1, the pressure is high and the temperature low, meaning the solution is a solid. In section two, both the pressure and temperature are intermediate, meaning the solution is a liquid. In other words, the segment that Point A is on is the equilibrium line between solid and liquid, thus, melting and freezing are occurring at Point A.
Example Question #151 : Physical Chemistry
Phase diagrams are used to depict changes in the properties of a solution at different temperatures and pressures. Below is a phase diagram of a polar solution.
What processes are occurring at Point C?
Vaporization/condensation
Freezing/melting
None of these
Deposition/sublimation
Vaporization/condensation
First, it is important to identify what phases are occurring on each side of the line on which Point C rests. In section two, both the pressure and temperature are intermediate, meaning the solution is a liquid. In section three, both the pressure and temperature are high, meaning the solution is a gas. In other words, the segment that Point C is on is the equilibrium line between liquid and gas, thus, vaporization and condensation are occurring at Point C.
Example Question #1 : Phase Diagrams
Phase diagrams are used to depict changes in the properties of a solution at different temperatures and pressures. Below is a phase diagram of a polar solution.
What processes are occurring at Point E?
Deposition/sublimation
Vaporization/condensation
Freezing/melting
None of these
Deposition/sublimation
First, it is important to identify what phases are occurring on each side of the line on which Point E rests. In section 1, the pressure is high and the temperature low, meaning the solution is a solid. In section three, both the pressure and temperature are high, meaning the solution is a gas. In other words, the segment that Point E is on is the equilibrium line between solid and gas, thus, deposition and sublimation are occurring at Point E.
Example Question #152 : Physical Chemistry
Phase diagrams are used to depict changes in the properties of a solution at different temperatures and pressures. Below is a phase diagram of a polar solution.
What molecule has a phase diagram similar to the one presented?
Water
Mercury
Bromine
Hydrogen
Water
While this may seem like an obscure question, the MCAT specifically requires you to know the shape of the water phase diagram. Unique to only a few molecules, the solid phase in our diagram is less dense than the liquid phase, meaning that the solid/liquid phase line has a negative slope (this can be seen as segment AD in the above image). Water is one of the select few compounds with this characteristic.

Certified Tutor

Certified Tutor

All MCAT Physical Resources

