ISEE Upper Level Quantitative : How to find the common part of a Venn Diagram
Study concepts, example questions & explanations for ISEE Upper Level Quantitative


All ISEE Upper Level Quantitative Resources
Example Questions
Example Question #11 : Data Analysis
What is the greatest common factor of 


To solve for the greatest common factor, it is necessary to get your numbers into prime factor form. For each of your numbers, this is:


Next, for each of your sets of prime factors, you need to choose the exponent for which you have the smallest value; therefore, for your values, you choose:


Taking these together, you get:

Example Question #12 : Data Analysis
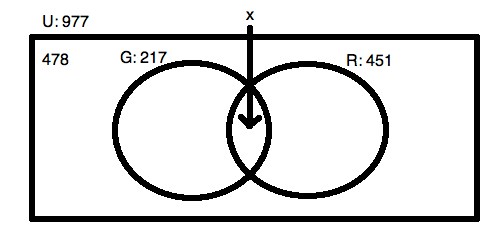
For the Venn Diagram pictured above, what is the value 


Solving for the overlap of two sets is easy when you have all of your data. You know that the two circles added up will have to equal 


Because the overlap happens once in each circle, you know that:

Given your data, you know:

Solving, this means:


Example Question #1 : How To Find The Common Part Of A Venn Diagram
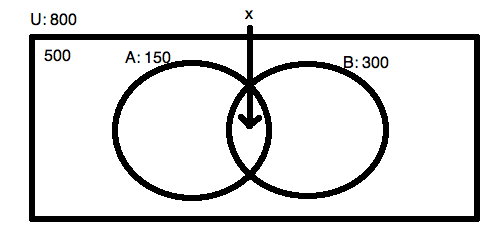
For the Venn Diagram pictured above, what is the value 


No answer possible.

Solving for the overlap of two sets is easy when you have all of your data. You know that the two circles added up will have to equal 


Because the overlap happens once in each circle, you know that:

Given your data, you know:

Solving, this means: 

Example Question #2 : How To Find The Common Part Of A Venn Diagram
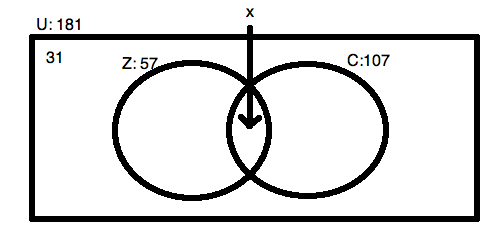
For the Venn Diagram pictured above, what is the value 


Solving for the overlap of two sets is easy when you have all of your data. You know that the two circles added up will have to equal 


Because the overlap happens once in each circle, you know that:

Given your data, you know:

Solving, this means:


Example Question #15 : Data Analysis
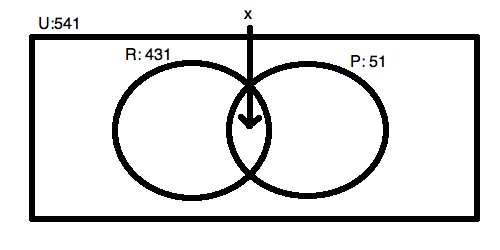
For the Venn Diagram pictured above, what is the value 


No answer is possible.


No answer is possible.
Do not be tricked by this question! In order to solve for the overlap, you need to know the amount that is in the area outside of the circles but still inside the universal box area! You cannot figure out the answer without knowing this fact; therefore, you must select "No answer is possible." We know that the two circles do not exhaust the universe because 


Certified Tutor

Certified Tutor

All ISEE Upper Level Quantitative Resources

