ISEE Upper Level Quantitative : Data Analysis and Probability
Study concepts, example questions & explanations for ISEE Upper Level Quantitative


All ISEE Upper Level Quantitative Resources
Example Questions
Example Question #1 : Data Analysis

Let the universal set 


Examine the above Venn diagram. If each integer was to be placed in its correct region, which of the following would be placed in the gray area?


None of the other choices is correct.
None of the other choices is correct.
The grayed portion of the Venn diagram corresponds to those integers which are not in any of 


All four choices have been eliminated.
Example Question #1 : Data Analysis
In the above Venn diagram, the universal set is defined as 
What is 


Example Question #1 : Data Analysis And Probability
In a school of 


No answer is possible.


Based on the information given, you can construct the following Venn Diagram:

In order to find the overlap, you need to find out how many are in the circles together. This is easy. Subtract: 


Solving for 


Example Question #1 : Venn Diagrams
In a group of 


No answer possible


Based on the information given, you can draw the following Venn Diagram:

To solve this, remember that the total number of values in the two circles is:

(We must do this because of the overlap. You need to subtract out one instance of that overlap.)
If we assign the value 


Example Question #2 : Data Analysis
In a group of plants, 


Based on the information, you can draw the following Venn Diagram:

It is very easy to solve for the number of plants that have green leaves but not large ones. This is merely 
Example Question #4 : Venn Diagrams
In a group of 


Cannot be determined


Based on the information given, you can draw the following Venn Diagram:

Now, you must begin by solving for 


Now, we can find the number of people with only books by subtracting 


Example Question #5 : Data Analysis And Probability
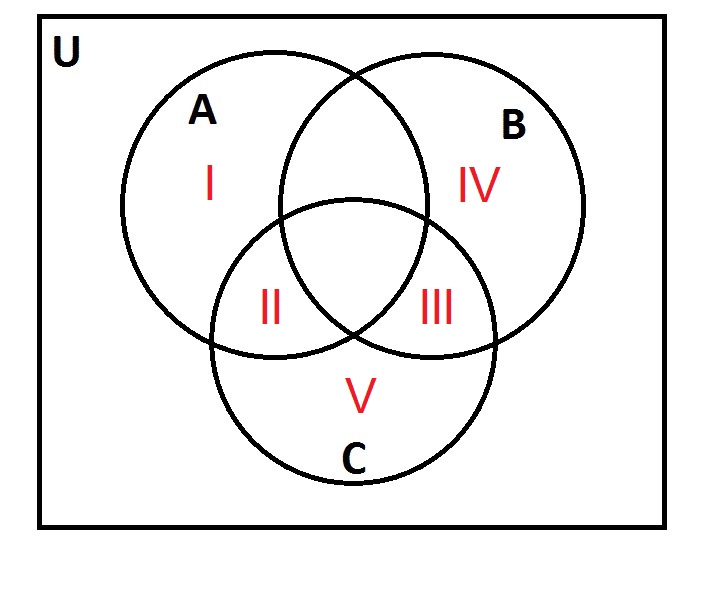
Examine the above Venn diagram. Let 


James Abram Garfield was born in Ohio in 1831. In which region would he fall?
IV
I
III
V
II
V
Carter would not fall in set A, since he was not a President born in Virginia.
He would not fall in B, since he was born before 1850.
He would fall in C, since his first name is James.
He would fall in the region included in set C, but not A or B - this is Region V.
Example Question #6 : Data Analysis And Probability
Examine the above Venn diagram. Let 


James Earl Carter was born in Georgia in 1924. In which region would he fall?
V
IV
II
III
I
III
Carter would not fall in set A, since he was not a President born in Virginia.
He would fall in B, since he was born after 1850.
He would fall in C, since his first name is James.
He would fall in the region included in sets B and C, but not A - this is Region III.
Example Question #9 : Venn Diagrams

Examine the above Venn diagram. Let universal set 
Let 


Which of the following would be a subset of the set represented by the shaded region in the diagram?
Note: for purposes of this question, "Y" is considered a consonant.
{price, value, pinna, trove, three}
{eagle, uvula, apnea, unsee, abide}
{usher, aspen, ester, order, earth}
{catfish, division, rot, status, giving}
{potato, tomato, breeze, mimosa, magnolia}
{price, value, pinna, trove, three}
The subset must comprise words that fall inside set 


Therefore, all of the words in the subset must have exactly five letters, but cannot begin with a vowel or end with a consonant - that is, we are looking for a set of five-letter words that begin with a consonant and end with a vowel.
The only set among the five choices that matches this description is the set
{price, value, pinna, trove, three}.
Example Question #7 : Data Analysis And Probability

Examine the above Venn diagram. Let universal set 
Let 


Which of the following would be a subset of the set represented by the shaded region in the diagram?
Note: for purposes of this question, "Y" is considered a consonant.
{plateau, portmanteau, calliope, marionette, taco}
{tomato, potato, ravine, cabana, marine}
{autism, enough, ideals, occult, unduly}
{autistic, estrogen, ideology, opal, understand}
{apnea, esoterica, irradiate, opulence, uvula}
{plateau, portmanteau, calliope, marionette, taco}
The subset must comprise words that fall inside sets 


Of the given choices, the only set whose elements fit this description is {plateau, portmanteau, calliope, marionette, taco}.

Certified Tutor

Certified Tutor

All ISEE Upper Level Quantitative Resources

