ISEE Upper Level Math : Data Analysis
Study concepts, example questions & explanations for ISEE Upper Level Math


All ISEE Upper Level Math Resources
Example Questions
Example Question #15 : How To Find The Answer From A Table
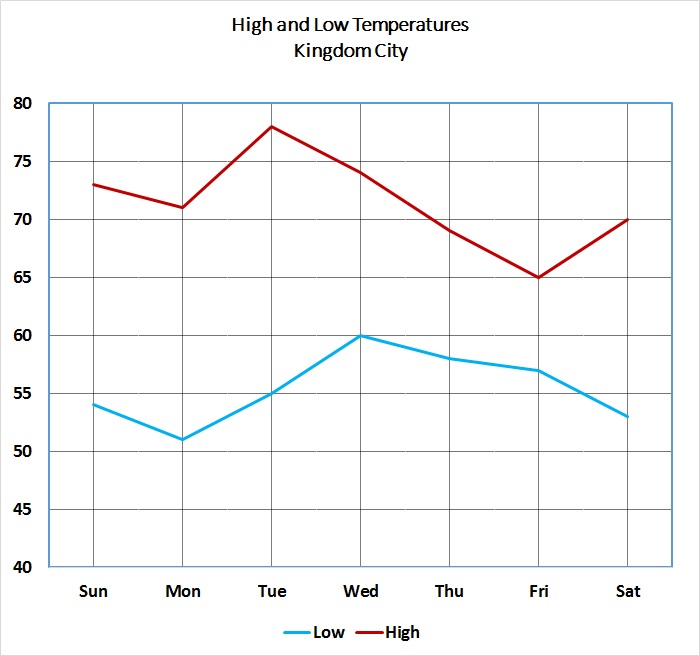
Refer to the above graph, which shows the high and low temperatures for Kingdom City over a one-week period. The temperatures at left are given in degrees Fahrenheit.
Temperatures given in degrees Fahrenheit can be converted to the Celsius scale using the formula
")
Express the highest temperature of the week in degrees Celsius (nearest whole degree).


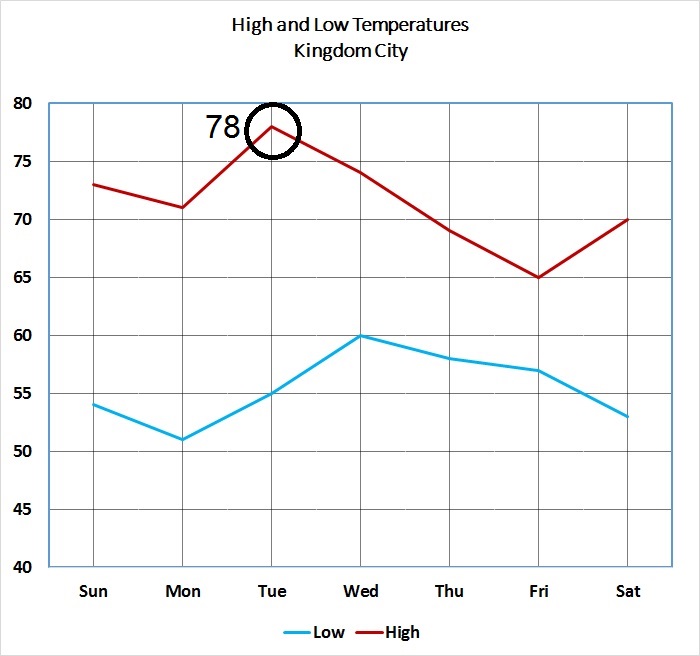
As can be seen below, the highest temperature for the week was 78 degrees Fahrenheit, on Tuesday.
To convert this to degrees Celsius, set 
")
 = \frac{5}{9} \cdot 46= 25 \frac{5}{9}^{\circ }C")

Example Question #16 : How To Find The Answer From A Table
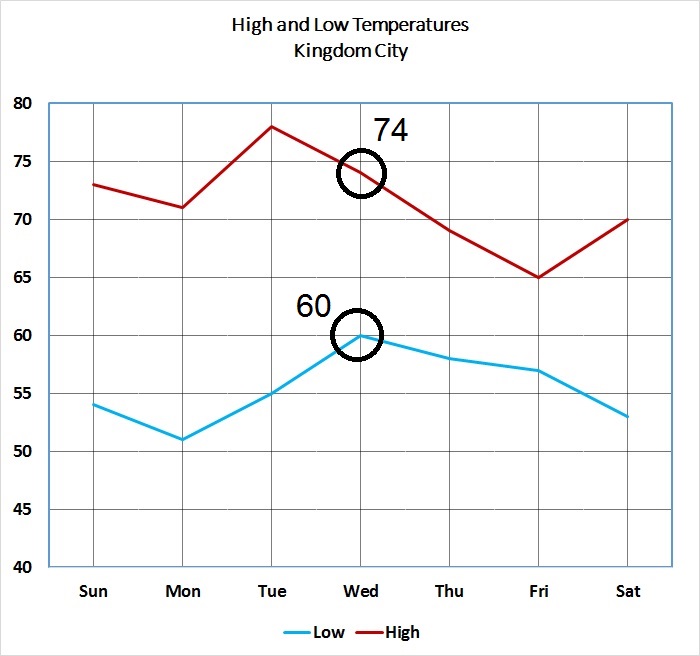
Refer to the above graph, which shows the high and low temperatures for Kingdom City over a one-week period.
The high temperature on Wednesday occurred at 1:00 PM; the low temperature, at the end of the day (midnight). The temperature drop was steady. What was the average drop in temperature per hour between 1:00 PM and midnight (nearest tenth of a second)?
1.7 degrees per hour
2.1 degrees per hour
1.3 degrees per hour
2.5 degrees per hour
1.3 degrees per hour
As can be seen in the diagram below, the high and low temperatures on Wednesday were, respectively, 74 and 60 degrees, for a drop of 
This drop occurred over a period of 

degrees per hour. The quotient of this is seen below:
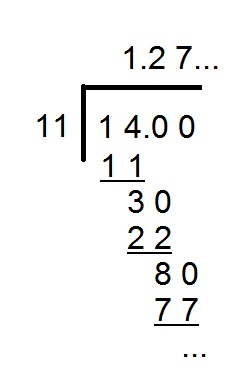
This rounds to 1.3 seconds.
Example Question #17 : How To Find The Answer From A Table
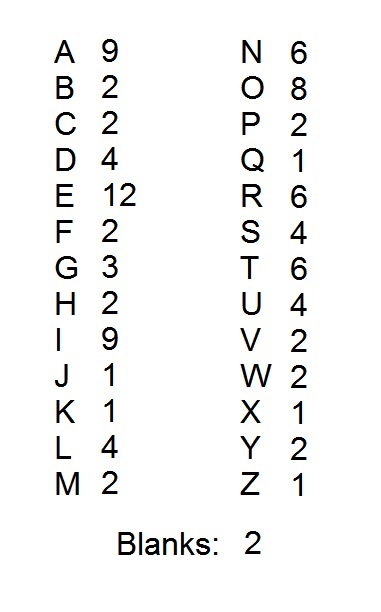
A popular word game uses one hundred tiles, each of which is marked with a letter or a blank. The distribution of the tiles is shown above, with each letter paired with the number of tiles marked with that letter. Notice that there are two blank tiles.
All of the consonant tiles are placed in a box. It is desired to place just enough of the vowel tiles so that the probability of drawing a vowel is 
Note: for purposes of this question, "Y" is a consonant.


There are nine "A" tiles, twelve "E" tiles, nine "I" tiles, eight "O" tiles, and four "U" tiles. This is a total of

There are also two blanks, so the number of tiles marked with consonants is
 = 100 - 44 = 56")
For the probability of drawing a vowel tile to be 

If we let 


Example Question #18 : How To Find The Answer From A Table
In a class of 
| Number of Siblings | Number of Students with the Specific Number of Siblings |
| 0 | 5 |
| 1 | 9 |
| 2 | 4 |
| 3 | 2 |
What is the mode for the number of siblings for this class?


Recall that the mode is the number that appears most often in a data set.
For this class, 


Example Question #1 : Median
The following are the scores from a math test in a given classroom. What is the median score?


To find the median you need to arrange the values in numerical order.
Starting with this:

Rearrange to look like this:

If there are an odd number of values, the median is the middle value. In this case there are 8 values so the median is the average (or mean) of the two middle values.
\div2=76")
Example Question #2 : Median
The median of nine consecutive integers is 604. What is the greatest integer?


The median of nine (an odd number) integers is the one in the middle when the numbers are arranged in ascending order; in this case, it is the fifth lowest. Since the nine integers are consecutive, the greatest integer is four more than the median, or 
Example Question #3 : Median
The median of 


We know that the numbers should be arranged in ascending order to find the median. When the number of values is odd, the median is the single middle value. In this question we have 


Example Question #4 : Median
What is the median of the frequency distribution shown in the table:


There are 


So:

Example Question #5 : How To Find Median
Scores from a math test in a given classroom are as follows:

What is the median score?


In order to find the median the data must first be ordered. So we have:

In this problem the number of values is even. We know that when the number of values is even, the median is the mean of the two middle values. So we get:

Example Question #6 : How To Find Median
Heights of a group of students in a high school are as follows (heights are given in 

Find the median height.


In order to find the median the data must first be ordered. So we have:

When the number of values is odd, the median is the single middle value. In this problem we have nine values. So the median is th 


Certified Tutor

Certified Tutor

All ISEE Upper Level Math Resources

