GRE Subject Test: Chemistry : Diagrams, Graphs, and Tables
Study concepts, example questions & explanations for GRE Subject Test: Chemistry


All GRE Subject Test: Chemistry Resources
Example Questions
Example Question #1 : Diagrams, Graphs, And Tables
A researcher performs a Bradford assay to determine the quantity of an unknown protein in his sample. The standard protein returns absorbance values of 0.101, 0.204, 0.302, 0.405 for the respective quantities of 10ug, 20ug, 30ug, and 40ug of protein. The unknown sample returns an absorbance value of 0.265. What is the quantity of protein in the unknown sample?


For this problem we need to determine the equation of our standard curve. This can be done by creating a graph from the data points and determining the slope.
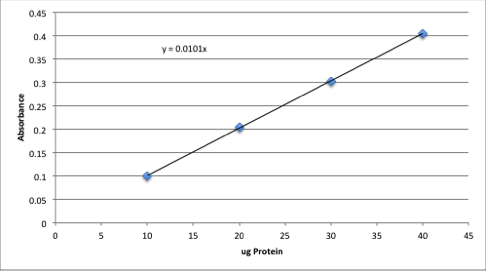
Assuming that a sample of zero concentration will also have zero absorbance, we can find the equation for the line generated by finding the slope.


Pick two points on the line to find the slope. We will use (0,0) and (40,0.405).

x+0")
Use this equation and the absorbance given in the question to find the concentration of the unknown sample.
x")

Example Question #281 : Gre Subject Test: Chemistry
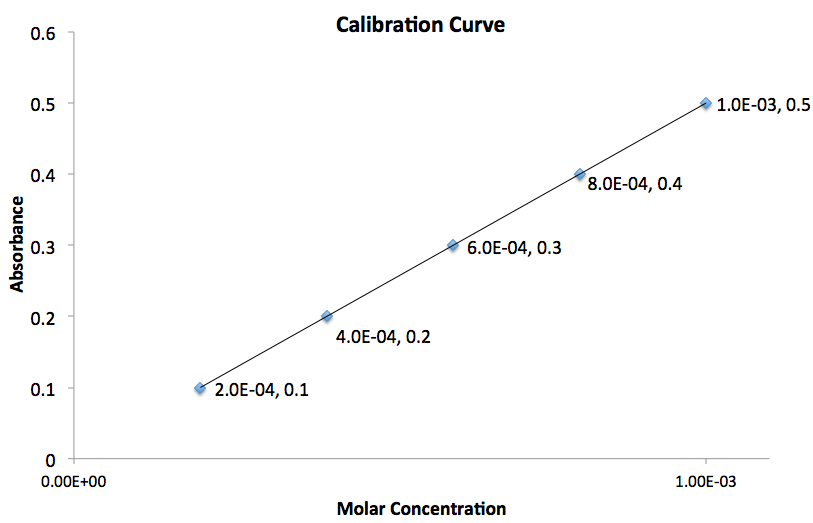
Using the graph given, what is the value for the slope of the line?


The slope of the line, 

The subscripts are simply the points you chose in the order you arbitrarily chose.The most important thing to do is plug the values into equation in the order you chose them.
To determine the slope of the line we need to use two points on the graph. Assuming the two points chosen correspond to ")
")
}{(1\times 10^{-3})-(2\times 10^{-4})}=500")
Therefore the slope of the line is equal to


Certified Tutor


All GRE Subject Test: Chemistry Resources

