Common Core: High School - Statistics and Probability : Conditional Probability & the Rules of Probability
Study concepts, example questions & explanations for Common Core: High School - Statistics and Probability


All Common Core: High School - Statistics and Probability Resources
Example Questions
Example Question #271 : High School: Statistics & Probability
A high school wants to assess the science elective courses that its students have chosen for their next year of education. Seven freshmen, fifty-eight sophomores, seven juniors, and fifty seniors chose to take astronomy. Eighteen freshmen, twenty-four sophomores, thirty-three juniors, and twenty seniors are planning to take ecology. Twelve freshmen, thirty-eight sophomores, eighteen juniors, and twenty-five seniors want to take physics. Last, four freshmen, fourteen sophomores, fifteen juniors, and twenty-eight seniors chose to take chemistry.
Use this information to create a two-way frequency table and calculate the probability that a senior will take astronomy.

Cannot be determined


In order to solve this problem, we need to discuss probabilities. A probability is generally defined as the chances or likelihood of an event occurring. It is calculated by identifying two components: the event and the sample space. The event is defined as the favorable outcome or success that we wish to observe. On the other hand, the sample space is defined as the set of all possible outcomes for the event. Mathematically we calculate probabilities by dividing the event by the sample space:

Let's use a simple example: the rolling of a die. We want to know the probability of rolling a one. We know that the sample space is six because there are six sides or outcomes to the die. Also, we know that there is only a single side with a value of one; therefore,

Now, let's convert this into a percentage:

Probabilities expressed in fraction form will have values between zero and one. One indicates that an event will definitely occur, while zero indicates that an event will not occur. Likewise, probabilities expressed as percentages possess values between zero and one hundred percent where probabilities closer to zero are unlikely to occur and those close to one hundred percent are more likely to occur.

Now, we will start by constructing a table. The question presents data associated with two different types of variables: grade level and class. There are four grade levels (i.e. freshman, sophomores, juniors, and seniors) and four elective science classes (i.e. astronomy, ecology, physics, and chemistry). We need to make a table that has four rows and four columns. Next, we can input the data contained in the table. Last we will add up each row and column in order to gain totals for each variable. If you have done this properly, then you should have created a table similar to the following:

After, the two-way table has been constructed you can then use it to solve the question: what is the probability that a senior will take astronomy?
First, we need to create the following ratio: number seniors planning to take the astrology class to the total number of seniors.
=\frac{\textup{number of seniors in astronomy}}{\textup{total number of seniors}}")
Substitute values using the table and solve.
=\frac{ 50 }{ 218 }")
= 0.23")
Example Question #272 : High School: Statistics & Probability
A high school wants to assess the science elective courses that its students have chosen for their next year of education. 6 freshmen 43 sophomores 5 juniors, and 22 seniors chose to take astronomy. Eighteen freshmen, twenty-four sophomores, thirty-three juniors, and twenty seniors are planning to take ecology. Twelve freshmen, thirty-eight sophomores, eighteen juniors, and twenty-five seniors want to take physics. Last, four freshmen, fourteen sophomores, fifteen juniors, and twenty-eight seniors chose to take chemistry.
Use this information to create a two-way frequency table and calculate the probability that a senior will take astronomy.


Cannot be determined


In order to solve this problem, we need to discuss probabilities. A probability is generally defined as the chances or likelihood of an event occurring. It is calculated by identifying two components: the event and the sample space. The event is defined as the favorable outcome or success that we wish to observe. On the other hand, the sample space is defined as the set of all possible outcomes for the event. Mathematically we calculate probabilities by dividing the event by the sample space:

Let's use a simple example: the rolling of a die. We want to know the probability of rolling a one. We know that the sample space is six because there are six sides or outcomes to the die. Also, we know that there is only a single side with a value of one; therefore,

Now, let's convert this into a percentage:

Probabilities expressed in fraction form will have values between zero and one. One indicates that an event will definitely occur, while zero indicates that an event will not occur. Likewise, probabilities expressed as percentages possess values between zero and one hundred percent where probabilities closer to zero are unlikely to occur and those close to one hundred percent are more likely to occur.

Now, we will start by constructing a table. The question presents data associated with two different types of variables: grade level and class. There are four grade levels (i.e. freshman, sophomores, juniors, and seniors) and four elective science classes (i.e. astronomy, ecology, physics, and chemistry). We need to make a table that has four rows and four columns. Next, we can input the data contained in the table. Last we will add up each row and column in order to gain totals for each variable. If you have done this properly, then you should have created a table similar to the following:

After, the two-way table has been constructed you can then use it to solve the question: what is the probability that a senior will take astronomy?
First, we need to create the following ratio: number seniors planning to take the astrology class to the total number of seniors.
=\frac{\textup{number of seniors in astronomy}}{\textup{total number of seniors}}")
Substitute values using the table and solve.
=\frac{ 22 }{ 190 }")
= 0.12")
Example Question #51 : Conditional Probability & The Rules Of Probability
A high school wants to assess the science elective courses that its students have chosen for their next year of education. Eight freshmen, twenty-two sophomores, nine juniors, and fifty-one seniors chose to take astronomy. Eighteen freshmen, twenty-four sophomores, thirty-three juniors, and twenty seniors are planning to take ecology. Twelve freshmen, thirty-eight sophomores, eighteen juniors, and twenty-five seniors want to take physics. Last, four freshmen, fourteen sophomores, fifteen juniors, and twenty-eight seniors chose to take chemistry.
Use this information to create a two-way frequency table and calculate the probability that a senior will take astronomy.


Cannot be determined


In order to solve this problem, we need to discuss probabilities. A probability is generally defined as the chances or likelihood of an event occurring. It is calculated by identifying two components: the event and the sample space. The event is defined as the favorable outcome or success that we wish to observe. On the other hand, the sample space is defined as the set of all possible outcomes for the event. Mathematically we calculate probabilities by dividing the event by the sample space:

Let's use a simple example: the rolling of a die. We want to know the probability of rolling a one. We know that the sample space is six because there are six sides or outcomes to the die. Also, we know that there is only a single side with a value of one; therefore,

Now, let's convert this into a percentage:

Probabilities expressed in fraction form will have values between zero and one. One indicates that an event will definitely occur, while zero indicates that an event will not occur. Likewise, probabilities expressed as percentages possess values between zero and one hundred percent where probabilities closer to zero are unlikely to occur and those close to one hundred percent are more likely to occur.

Now, we will start by constructing a table. The question presents data associated with two different types of variables: grade level and class. There are four grade levels (i.e. freshman, sophomores, juniors, and seniors) and four elective science classes (i.e. astronomy, ecology, physics, and chemistry). We need to make a table that has four rows and four columns. Next, we can input the data contained in the table. Last we will add up each row and column in order to gain totals for each variable. If you have done this properly, then you should have created a table similar to the following:

After, the two-way table has been constructed you can then use it to solve the question: what is the probability that a senior will take astronomy?
First, we need to create the following ratio: number seniors planning to take the astrology class to the total number of seniors.
=\frac{\textup{number of seniors in astronomy}}{\textup{total number of seniors}}")
Substitute values using the table and solve.
=\frac{ 51 }{ 219 }")
= 0.23")
Example Question #1 : Explain Conditional Probability And Independence: Ccss.Math.Content.Hss Cp.A.5
A new test has been developed to detect lung cancer. A positive test result indicates lung cancer. There are, however, false positives, where the test incorrectly shows a positive result when there is no disease. Similarly, the test occassionally produces a negative result when a patient does in fact have lung cancer. All of the following are accurate EXCEPT:
=\frac{P(+\mid cancer)\cdot P(cancer)}{P(+)}")
=P(cancer)\cdot P(+\mid cancer)+P(no\ cancer)\cdot P(+\mid no\ cancer)")
=\frac{P(+\mid cancer)}{P(+)}")
=\frac{P(-\mid cancer)\cdot P(cancer)}{P(-)}")
=P(cancer)\cdot P(-\mid cancer)+P(no\ cancer)\cdot P(-\mid no\ cancer)")
Example Question #2 : Explain Conditional Probability And Independence: Ccss.Math.Content.Hss Cp.A.5
Determine whether or not the following scenario represents a conditional probability.
A doctor wants to determine a patient's risk to heart disease knowing that the patient has a history of high cholesterol.
Cannot be determined
No, the probability of heart disease is independent of cholesterol levels
Yes, the probability of having high cholesterol is dependent on heart disease
Yes, the probability of heart disease is dependent on high cholesterol levels
Yes, the probability of heart disease is dependent on high cholesterol levels
In order to solve this problem, we need to discuss probabilities and more specifically conditional probabilities. We will start with discussing probabilities in a general sense. A probability is generally defined as the chances or likelihood of an event occurring. It is calculated by identifying two components: the event and the sample space. The event is defined as the favorable outcome or success that we wish to observe. On the other hand, the sample space is defined as the set of all possible outcomes for the event. Mathematically we calculate probabilities by dividing the event by the sample space:

Let's use a simple example: the rolling of a die. We want to know the probability of rolling a one. We know that the sample space is six because there are six sides or outcomes to the die. Also, we know that there is only a single side with a value of one; therefore,

Now, let's convert this into a percentage:


Probabilities expressed in fraction form will have values between zero and one. One indicates that an event will definitely occur, while zero indicates that an event will not occur. Likewise, probabilities expressed as percentages possess values between zero and one hundred percent where probabilities closer to zero are unlikely to occur and those close to one hundred percent are more likely to occur.

Now that we understand the definition of a probability in its most general sense, we can investigate conditional probabilities. A conditional probability is defined as the probability that event B will occur given the information that an event A has already occurred.

It is expressed using the following equation:
 = {}\frac{P(A\cap B)}{P(A)}")
In this equation, the probability of event B given that event A has occurred is equal to the probability of the intersection of events A and B divided by the probability of event A. It is important to note that if the events are independent, then the probability of event B given event A is simply the probability of event B because event A does not affect it.
Now, that we have an understanding of conditional probabilities let's investigate the scenario in the question. In the question, the doctor wants to know a patient's risk of heart disease. This represents the event that may occur. Next, the doctor knows that the patient has a history of high cholesterol. This information represents given information; thus, this scenario represents a conditional probability. This probability may be denoted in the following way:
")
This is read as "the probability of a patient having heart disease given that he or she has high cholesterol." This relationship is not the reverse because we want to know the risk of heart disease and we know that the patient has high cholesterol; therefore, high cholesterol is not dependent on high cholesterol in this particular scenario. The correct answer is the following: "Yes, the probability of heart disease is dependent on high cholesterol levels."
Example Question #1 : Explain Conditional Probability And Independence: Ccss.Math.Content.Hss Cp.A.5
Determine whether or not the following scenario represents a conditional probability.
The chances of drawing a jack after drawing a jack of spades and then replacing the card back into the deck.
Cannot be determined
No, the probability of drawing a jack is independent of the first draw because the card is replaced
Yes, the probability of drawing a jack is dependent on the first draw because the card is not replaced
Yes, the probability of drawing a jack is dependent on the first draw because the card is replaced
No, the probability of drawing a jack is independent of the first draw because the card is replaced
In order to solve this problem, we need to discuss probabilities and more specifically conditional probabilities. We will start with discussing probabilities in a general sense. A probability is generally defined as the chances or likelihood of an event occurring. It is calculated by identifying two components: the event and the sample space. The event is defined as the favorable outcome or success that we wish to observe. On the other hand, the sample space is defined as the set of all possible outcomes for the event. Mathematically we calculate probabilities by dividing the event by the sample space:
Let's use a simple example: the rolling of a die. We want to know the probability of rolling a one. We know that the sample space is six because there are six sides or outcomes to the die. Also, we know that there is only a single side with a value of one; therefore,
Now, let's convert this into a percentage:
Probabilities expressed in fraction form will have values between zero and one. One indicates that an event will definitely occur, while zero indicates that an event will not occur. Likewise, probabilities expressed as percentages possess values between zero and one hundred percent where probabilities closer to zero are unlikely to occur and those close to one hundred percent are more likely to occur.
Now that we understand the definition of a probability in its most general sense, we can investigate conditional probabilities. A conditional probability is defined as the probability that event B will occur given the information that an event A has already occurred.
It is expressed using the following equation:
In this equation, the probability of event B given that event A has occurred is equal to the probability of the intersection of events A and B divided by the probability of event A. It is important to note that if the events are independent, then the probability of event B given event A is simply the probability of event B because event A does not affect it.
Now, that we have an understanding of conditional probabilities let's investigate the scenario in the question. In the question, we want to know the chances of drawing a jack after drawing a jack of spades and replacing it in the deck. The chances of drawing a jack in the first draw was four out of fifty-two. Now, that the card has been replaced the chances of drawing a jack are four out of fifty-two; however, if the card were not replaced then the chances of drawing another jack would have been reduced to three out of fifty-two. Since, the card was replaced, the probability of drawing a jack on the second draw is independent of the first; therefore, the following choice is correct: "No, the probability of drawing a jack is independent of the first draw because the card is replaced."
Example Question #281 : High School: Statistics & Probability
Suppose that three construction workers—Bob, Tim, and Al—are completing the frames for three interior walls of a new home. Each wall is of equal size and requires six two inch by four inch boards to complete. There are seventeen boards in a pile and new ones will not be delivered until after lunch. Bob selects his lumber first, then Tim, and Al is the last person to get lumber for the beginning of the day. Assume that all boards are identical and one is not favored over another.
Given that each worker uses at least five boards, what is the probability that Bob will finish his wall project before lunchtime?
Cannot be determined


In order to solve this problem, we need to discuss probabilities and more specifically conditional probabilities. We will start with discussing probabilities in a general sense. A probability is generally defined as the chances or likelihood of an event occurring. It is calculated by identifying two components: the event and the sample space. The event is defined as the favorable outcome or success that we wish to observe. On the other hand, the sample space is defined as the set of all possible outcomes for the event. Mathematically we calculate probabilities by dividing the event by the sample space:
Let's use a simple example: the rolling of a die. We want to know the probability of rolling a one. We know that the sample space is six because there are six sides or outcomes to the die. Also, we know that there is only a single side with a value of one; therefore,
Now, let's convert this into a percentage:
Probabilities expressed in fraction form will have values between zero and one. One indicates that an event will definitely occur, while zero indicates that an event will not occur. Likewise, probabilities expressed as percentages possess values between zero and one hundred percent where probabilities closer to zero are unlikely to occur and those close to one hundred percent are more likely to occur.
Now that we understand the definition of a probability in its most general sense, we can investigate conditional probabilities. A conditional probability is defined as the probability that event B will occur given the information that an event A has already occurred.
It is expressed using the following equation:
In this equation, the probability of event B given that event A has occurred is equal to the probability of the intersection of events A and B divided by the probability of event A. It is important to note that if the events are independent, then the probability of event B given event A is simply the probability of event B because event A does not affect it.
Now, that we have an understanding of conditional probabilities let's investigate the scenario in the question. In order to solve this problem we should first list all of the possible combinations that the men could take the boards if each chose at least one board. We can assume that each construction worker will choose at least one board because they all have a job to complete by the end of the day. After you tabulate these combinations, you should construct a table similar to the following:

Next, let's create a conditional probability formula using the information in the question. We want to know the probability that Bob will get his wall built by lunchtime given that each worker has used at least five boards:
 = {}\frac{P(B\cap A)}{P(A)}")
 = {}\frac{P(Bob\ finishes\ by\ lunch \cap Each\ worker\ uses\ 5\ boards )}{P(Each\ worker\ uses\ 5\ boards)}")
Now, let's find the probability that Bob finishes by lunch and each worker uses at least five boards. First, we will isolate the all of the combinations where Bob obtains six boards (i.e. the number of boards he needs to finish his wall by lunch).

Second, we will highlight the combinations in this series where every individual had at least five boards.

We can see that there re two instances where Bob has six boards and each worker has at least five boards; therefore, we can calculate the following probability:
=\frac{2}{120}")
=\frac{1}{60}")
=0.0167")
After we have calculated the probability of the intersection that Bob finishes by lunch and that each worker gets five boards, we can calculate the probability that each worker gets five boards. We will do this by combing through the data and finding every instance where each worker obtained more than five pieces of lumber. If you do this correctly, then you should construct a table similar to the following:

Now, we can calculate the probability that each worker will obtain at least five two inch by four inch pieces of lumber.
=\frac{6}{120}")
=\frac{1}{20}")
=0.0500")
Last, we can substitute these values into our equation for conditional probability and solve.
 = {}\frac{P(Bob\ finishes\ by\ lunch \cap Each\ worker\ uses\ 5\ boards )}{P(Each\ worker\ uses\ 5\ boards)}")
 = \frac{0.0167}{0.0500}")
 =0.3340")
Convert to a percentage.

Example Question #2 : Conditional Probability As Fraction Of Outcomes: Ccss.Math.Content.Hss Cp.B.6

Use the provided figure to identify:
")
= 1")
= \frac{2}{3}")
= \frac{1}{8}")
= \frac{1}{6}")
= \frac{1}{3}")
In order to solve this problem, we need to discuss probabilities and more specifically conditional probabilities. We will start with discussing probabilities in a general sense. A probability is generally defined as the chances or likelihood of an event occurring. It is calculated by identifying two components: the event and the sample space. The event is defined as the favorable outcome or success that we wish to observe. On the other hand, the sample space is defined as the set of all possible outcomes for the event. Mathematically we calculate probabilities by dividing the event by the sample space:
Let's use a simple example: the rolling of a die. We want to know the probability of rolling a one. We know that the sample space is six because there are six sides or outcomes to the die. Also, we know that there is only a single side with a value of one; therefore,
Now, let's convert this into a percentage:
Probabilities expressed in fraction form will have values between zero and one. One indicates that an event will definitely occur, while zero indicates that an event will not occur. Likewise, probabilities expressed as percentages possess values between zero and one hundred percent where probabilities closer to zero are unlikely to occur and those close to one hundred percent are more likely to occur.
Now that we understand the definition of a probability in its most general sense, we can investigate conditional probabilities. A conditional probability is defined as the probability that event B will occur given the information that an event A has already occurred.
It is expressed using the following equation:
 = {}\frac{P(A\cap B)}{P(A)}")
In this equation, the probability of event B given that event A has occurred is equal to the probability of the intersection of events A and B divided by the probability of event A. It is important to note that if the events are independent, then the probability of event B given event A is simply the probability of event B because event A does not affect it.
Now, that we have an understanding of conditional probabilities let's investigate an example scenario. Let's use this information to calculate ")
Given the information in the diagram and our knowledge of conditional probabilities we can derive the following equation:
=\frac{P (A \cap C)}{P(C)}")
Let's start by calculating the probability of the intersection of events A and C. In the digram there are 
= 2")
Now, let's calculate the probability of event C. In the diagram we can see that circle C contains 
= 8")
Now that we have calculated the two necessary probabilities we can substitute them into our conditional probability equation and solve.
=\frac{P (A \cap C)}{P(C)}")
Substitute.
=\frac{2}{8}")
Solve.
= \frac{1}{4}")
Now that we have worked through an example, let's investigate the scenario in the given question. First, lets derive an equation for the conditional probability:
=\frac{P (A \cap C)}{P(C)}")
Let's identify the probability for the intersection of events A and C.
= 3")
Next, let's identify the probability of event C.
= 9")
Substitute and solve.
= \frac{3}{9}")
Reduce.
= \frac{1}{3}")
Example Question #3 : Conditional Probability As Fraction Of Outcomes: Ccss.Math.Content.Hss Cp.B.6

Use the provided figure to identify:
")
= \frac{1}{4}")
= \frac{1}{4}")
= \frac{3}{4}")
= \frac{3}{5}")
= \frac{1}{2}")
In order to solve this problem, we need to discuss probabilities and more specifically conditional probabilities. We will start with discussing probabilities in a general sense. A probability is generally defined as the chances or likelihood of an event occurring. It is calculated by identifying two components: the event and the sample space. The event is defined as the favorable outcome or success that we wish to observe. On the other hand, the sample space is defined as the set of all possible outcomes for the event. Mathematically we calculate probabilities by dividing the event by the sample space:
Let's use a simple example: the rolling of a die. We want to know the probability of rolling a one. We know that the sample space is six because there are six sides or outcomes to the die. Also, we know that there is only a single side with a value of one; therefore,
Now, let's convert this into a percentage:
Probabilities expressed in fraction form will have values between zero and one. One indicates that an event will definitely occur, while zero indicates that an event will not occur. Likewise, probabilities expressed as percentages possess values between zero and one hundred percent where probabilities closer to zero are unlikely to occur and those close to one hundred percent are more likely to occur.
Now that we understand the definition of a probability in its most general sense, we can investigate conditional probabilities. A conditional probability is defined as the probability that event B will occur given the information that an event A has already occurred.
It is expressed using the following equation:
 = {}\frac{P(A\cap B)}{P(A)}")
In this equation, the probability of event B given that event A has occurred is equal to the probability of the intersection of events A and B divided by the probability of event A. It is important to note that if the events are independent, then the probability of event B given event A is simply the probability of event B because event A does not affect it.
Now, that we have an understanding of conditional probabilities let's investigate an example scenario. Let's use this information to calculate ")
Given the information in the diagram and our knowledge of conditional probabilities we can derive the following equation:
=\frac{P (A \cap C)}{P(C)}")
Let's start by calculating the probability of the intersection of events A and C. In the digram there are 
= 2")
Now, let's calculate the probability of event C. In the diagram we can see that circle C contains 
= 8")
Now that we have calculated the two necessary probabilities we can substitute them into our conditional probability equation and solve.
=\frac{P (A \cap C)}{P(C)}")
Substitute.
=\frac{2}{8}")
Solve.
= \frac{1}{4}")
Now that we have worked through an example, let's investigate the scenario in the given question. First, lets derive an equation for the conditional probability:
=\frac{P (A \cap C)}{P(C)}")
Let's identify the probability for the intersection of events A and C.
= 3")
Next, let's identify the probability of event C.
= 6")
Substitute and solve.
= \frac{3}{6}")
Reduce.
= \frac{1}{2}")
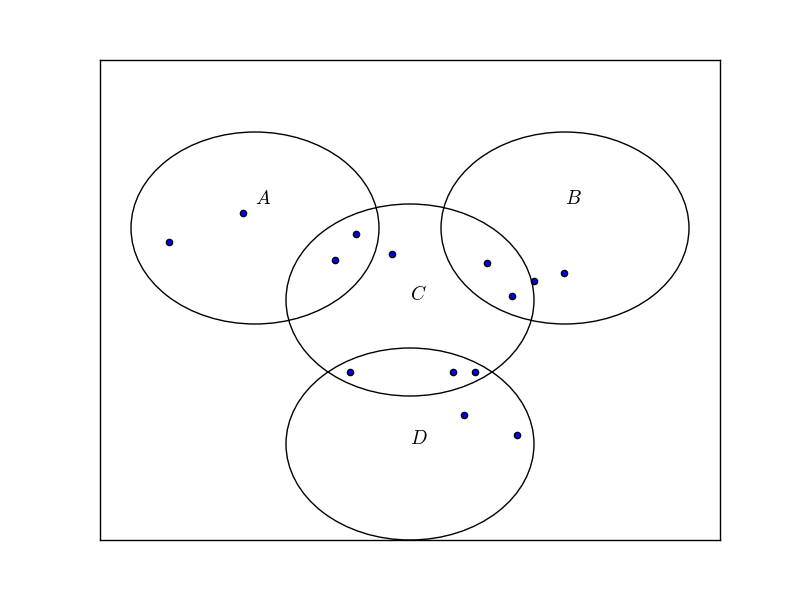
Example Question #4 : Conditional Probability As Fraction Of Outcomes: Ccss.Math.Content.Hss Cp.B.6

Use the provided figure to identify:
")
= \frac{1}{9}")
= 1")
= \frac{1}{3}")
= \frac{1}{5}")
= \frac{2}{3}")
In order to solve this problem, we need to discuss probabilities and more specifically conditional probabilities. We will start with discussing probabilities in a general sense. A probability is generally defined as the chances or likelihood of an event occurring. It is calculated by identifying two components: the event and the sample space. The event is defined as the favorable outcome or success that we wish to observe. On the other hand, the sample space is defined as the set of all possible outcomes for the event. Mathematically we calculate probabilities by dividing the event by the sample space:
Let's use a simple example: the rolling of a die. We want to know the probability of rolling a one. We know that the sample space is six because there are six sides or outcomes to the die. Also, we know that there is only a single side with a value of one; therefore,
Now, let's convert this into a percentage:
Probabilities expressed in fraction form will have values between zero and one. One indicates that an event will definitely occur, while zero indicates that an event will not occur. Likewise, probabilities expressed as percentages possess values between zero and one hundred percent where probabilities closer to zero are unlikely to occur and those close to one hundred percent are more likely to occur.
Now that we understand the definition of a probability in its most general sense, we can investigate conditional probabilities. A conditional probability is defined as the probability that event B will occur given the information that an event A has already occurred.
It is expressed using the following equation:
In this equation, the probability of event B given that event A has occurred is equal to the probability of the intersection of events A and B divided by the probability of event A. It is important to note that if the events are independent, then the probability of event B given event A is simply the probability of event B because event A does not affect it.
Now, that we have an understanding of conditional probabilities let's investigate an example scenario. Let's use this information to calculate
Given the information in the diagram and our knowledge of conditional probabilities we can derive the following equation:
Let's start by calculating the probability of the intersection of events A and C. In the digram there are
Now, let's calculate the probability of event C. In the diagram we can see that circle C contains
Now that we have calculated the two necessary probabilities we can substitute them into our conditional probability equation and solve.
Substitute.
Solve.
Now that we have worked through an example, let's investigate the scenario in the given question. First, lets derive an equation for the conditional probability:
=\frac{P (A \cap C)}{P(C)}")
Let's identify the probability for the intersection of events A and C.
= 1")
Next, let's identify the probability of event C.
= 9")
Substitute and solve.
= \frac{1}{9}")


All Common Core: High School - Statistics and Probability Resources

