All Common Core: 8th Grade Math Resources
Example Questions
Example Question #10 : Compare Properties Of Two Functions: Ccss.Math.Content.8.F.A.2
The table and the equation provided represent two different functions. Which of these two functions—either table or equation form—has the greater rate of change, and what is the rate of change?

The rate of change is also known as the slope. As we have learned we can use the following equation to solve for the slope of the table:
An input/output table displays sets of ordered pairs. The input column represents the x-values and the output column represents the y-values. We can select two sets of ordered pairs from the table to solve for the slope:
The slope for our table is
In order to determine the slope of the equation, we need to make sure the equation is in slope-intercept form:
In this equation, the variables 


The given formula for this problem was provided in slope-intercept form; thus, the slope for the equation is
The function with the greatest rate of change will possess the greatest slope. In this case, the greater slope is 
Example Question #31 : Functions
The table and the equation provided represent two different functions. Which of these two functions—either table or equation form—has the greater rate of change, and what is the rate of change?

The rate of change is also known as the slope. As we have learned we can use the following equation to solve for the slope of the table:
An input/output table displays sets of ordered pairs. The input column represents the x-values and the output column represents the y-values. We can select two sets of ordered pairs from the table to solve for the slope:
The slope for our table is
In order to determine the slope of the equation, we need to make sure the equation is in slope-intercept form:
In this equation, the variables 


The given formula for this problem was provided in slope-intercept form; thus, the slope for the equation is
The function with the greatest rate of change will possess the greatest slope. In this case, the greater slope is 
Example Question #11 : Compare Properties Of Two Functions: Ccss.Math.Content.8.F.A.2
The table and the equation provided represent two different functions. Which of these two functions—either table or equation form—has the greater rate of change, and what is the rate of change?

The rate of change is also known as the slope. As we have learned we can use the following equation to solve for the slope of the table:
An input/output table displays sets of ordered pairs. The input column represents the x-values and the output column represents the y-values. We can select two sets of ordered pairs from the table to solve for the slope:
The slope for our table is
In order to determine the slope of the equation, we need to make sure the equation is in slope-intercept form:
In this equation, the variables 


The given formula for this problem was provided in slope-intercept form; thus, the slope for the equation is
The function with the greatest rate of change will possess the greatest slope. In this case, the greater slope is 
Example Question #2 : Graphing Polynomial Functions
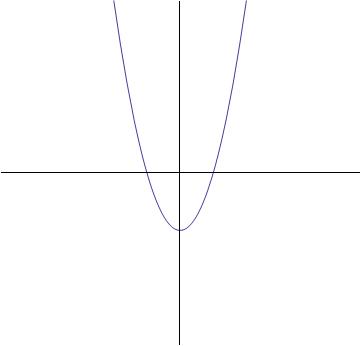
Which of the graphs best represents the following function?

None of these


The highest exponent of the variable term is two (
The graph below will be the answer, as it shows a parabolic curve.

Example Question #2 : Quadratic Functions
What is the equation of a parabola with vertex 


From the vertex, we know that the equation of the parabola will take the form 

To calculate that 


Now the equation is 
Expand the squared term:
Distribute the fraction through the parentheses:
Combine like terms:
Example Question #1 : Functions And Graphs
Which graph depicts a function?
Example Question #1 : Graphing Polynomial Functions
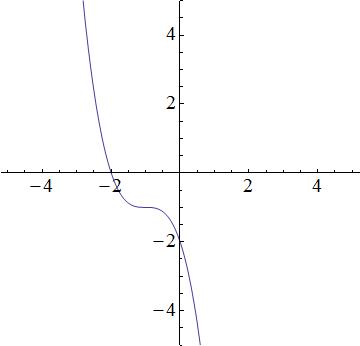
Which equation best represents the following graph?

None of these
We have the following answer choices.
The first equation is a cubic function, which produces a function similar to the graph. The second equation is quadratic and thus, a parabola. The graph does not look like a prabola, so the 2nd equation will be incorrect. The third equation describes a line, but the graph is not linear; the third equation is incorrect. The fourth equation is incorrect because it is an exponential, and the graph is not an exponential. So that leaves the first equation as the best possible choice.
Example Question #1 : How To Graph A Quadratic Function


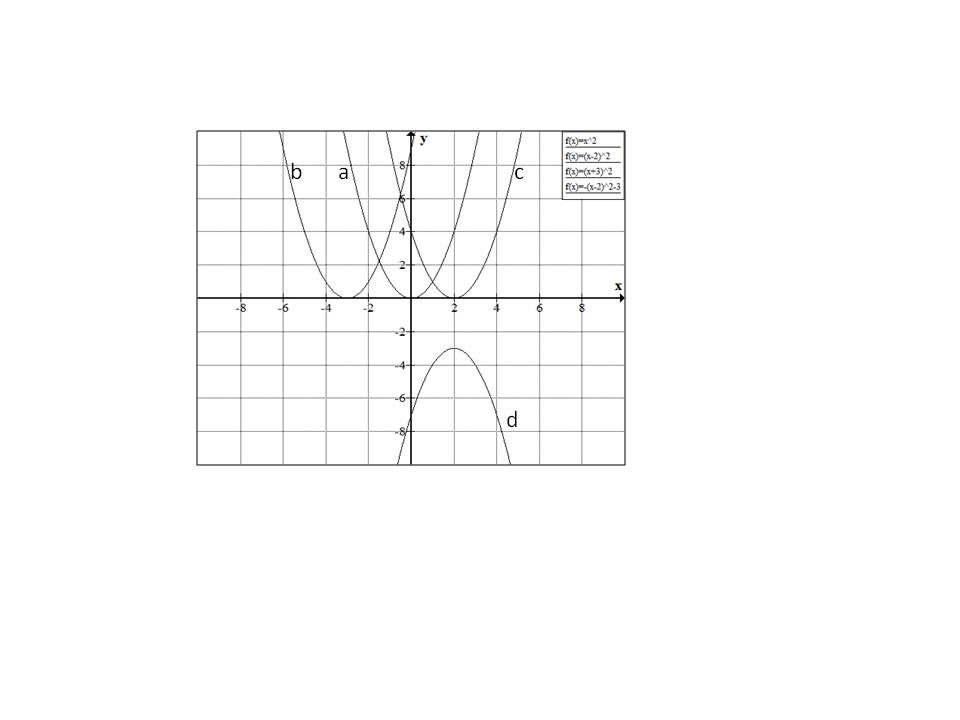
None of the above

Starting with


Similarly 

Hence the correct answer is option 
Example Question #271 : Grade 8
Select the equation that best represents a linear function.
In order to determine if an equation defines a linear function, we want to make sure that the equation of the line is in slope-intercept form:
If we are unable to put an equation in this form, then the equation is not linear.
Let's take a look at our answer choices:

Notice that in this equation our 
Though this equation is not written in 

Again, though this equation is not written in 

This equation is in slope-intercept form; thus, 
Example Question #1 : Understand Linear And Nonlinear Functions: Ccss.Math.Content.8.F.A.3
Select the equation that best represents a linear function.
In order to determine if an equation defines a linear function, we want to make sure that the equation of the line is in slope-intercept form:
If we are unable to put an equation in this form, then the equation is not linear.
Let's take a look at our answer choices:

Notice that in this equation our 
Though this equation is not written in 

Again, though this equation is not written in 

For this equation, we can solve for 
First, we can subtract 
Next, we can divide each side by
This equation is in slope-intercept form; thus, 
All Common Core: 8th Grade Math Resources


![\frac{\begin{array}[b]{r}6y+4x=16\\ -4x-4x\end{array}}{\\\\6y=-4x+16}](https://vt-vtwa-assets.varsitytutors.com/vt-vtwa/uploads/formula_image/image/963213/gif.latex)


