College Chemistry : Phase Diagrams
Study concepts, example questions & explanations for College Chemistry


All College Chemistry Resources
Example Questions
Example Question #1 : Phase Diagrams
Consider the typical phase diagram of a compound given below.
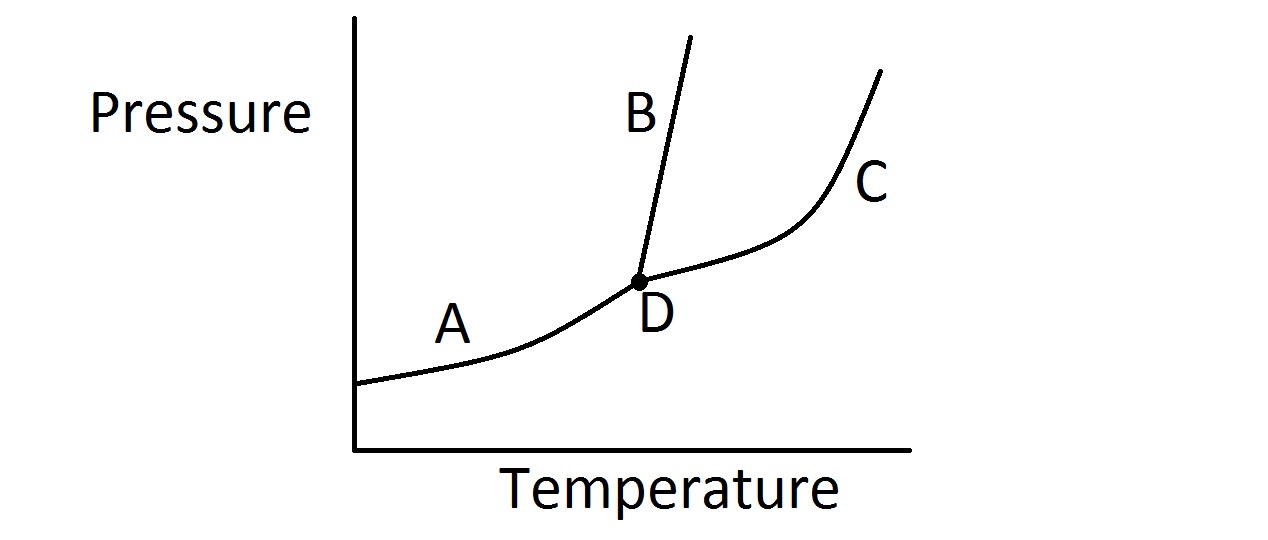
Which of the following lines or points on the diagram represents a situation in which the rate of vaporization of the compound is equal to its rate of condensation?
Line C
None of these
Line B
Point D
Line A
Line C
In this question, we're presented with a phase diagram and are asked to determine where on the graph the rate of vaporization equals the rate of condensation.
First, it's important to realize that when the rate of vaporization and condensation are equal, we have an equilibrium of liquid and gas phases. In other words, for a given temperature and pressure, the rate at which the liquid evaporates into a gas is exactly equal to the rate at which the gas condenses into a liquid.
On a phase diagram, the area of the upper left portion of the diagram represents the solid state. The middle portion of the diagram represents the liquid state. The bottom and right most part of the diagram represents the gas phase.
Furthermore, each line on the diagram represents the specific combination of temperature and pressure in which a given compound will exist in equilibrium between two phases. The point where all three lines intersect, however, represents the triple point. This tells us the temperature and pressure in which the compound will exist in an equilibrium between all three states.
Because we are looking for the equilibrium line that represents equilibrium of vaporization and condensation, we want the line that separates the liquid portion of the diagram from the gas portion. Based on the identification of regions on the diagram discussed above, that would be line C as shown in the diagram. Line A represents equilibrium between solid and gas (sublimation rate = deposition rate). Line B represents equilibrium between solid and liquid (melting rate = freezing rate).


Certified Tutor

All College Chemistry Resources

