Calculus 1 : Graphing Functions
Study concepts, example questions & explanations for Calculus 1


All Calculus 1 Resources
Example Questions
Example Question #1 : How To Graph Functions Of Curves
A B
B
C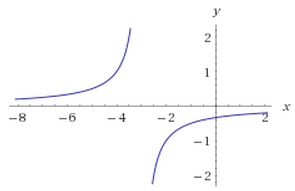 D
D
For which of the graphs of ")
=-\infty")
D
A
B
C
A
The condition reads 'the limit of f of x as x approaches three from the left'. Note that we're not looking at x as it approached negative three. Only A and B have infinite limites at positive 3 (C and D show limits as x approaches negative 3), so the answer must be one of these. We can see that from the left, B approaches positive infinity at x=3 from the left, while A approaches negative infinity at x=3 from the left, so the correct answer is A.
Example Question #4 : Other Curves
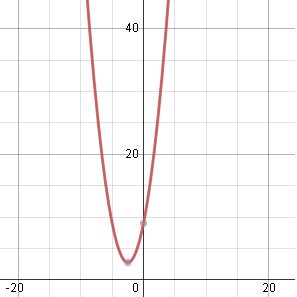
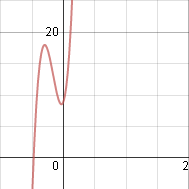
On what interval is the following function decreasing?

")
")
")
")
Since this is a quadratic function with a positive first coefficient, we know it only has one local minimum and no other extrema. So all we have to do is find the x coordinate corresponding to this value and we will have one endpoint of our interval, and it will be decreasing constantly as you approach this point from the left.
Recall,
 = n\cdot x^{n-1}")
So, if we take the derivative of this quadratic, we get
=10x-3")


So this is where our interval ends. Since there are no other local extrema, we know our interval is
")
Example Question #1 : How To Graph Functions Of Curves
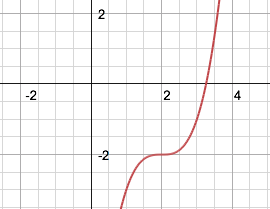
Which of the following is true about the twice-differentiable function 
<f'(2)<f(2)")
<f''(2)<f(2)")
<f(2)<f'(2)")
<f''(2)<f'(2)")
<f'(2)<f''(2)")
Since the function 

>0")
")
<0")
Furthermore, there exists an inflection point at 

Thus at 
=0")
Therefore, the correct answer is <f''(2)<f'(2)")
Example Question #6 : Other Curves
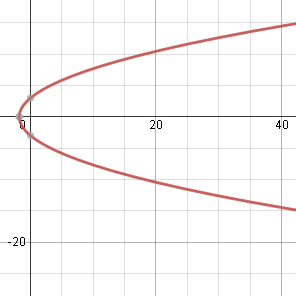
Which one of the following could be the integral of 


}{2}+\frac{10x^\frac{3}{2}}{3}+9")
Since the functions are added together, we can take each one seperately and add the results together.
The integral of 


The integral of 

which means it will equal
}\right)")

so combining these gives

as the integral, making 
Example Question #7 : Other Curves
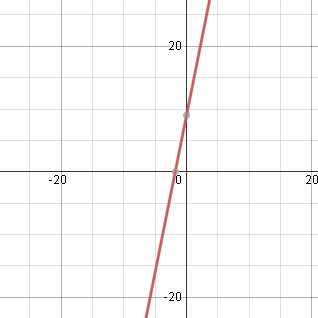
Exponential Function
What is the graph of the folloiwng function:


None of the above
Use the following values to plot the graph:


Example Question #2 : How To Graph Functions Of Curves
Trigonometric Function
Graph the folloiwng function:

None of the above
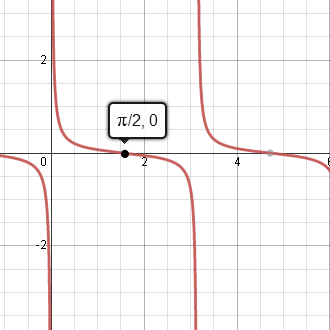
Plot the graph for the following values:

Example Question #1 : How To Graph Functions Of Area
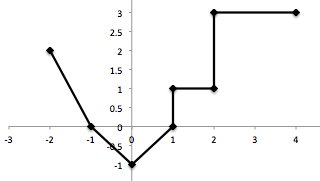
Graph of a piecewise-linear function 

Find
dx")


Find the area under the graph 

The areas are added to be:
(2)+\frac{1}{2}(1)(-1)+\frac{1}{2}(1)(-1)+(1)(1)+(2)(3)\right]=7")
Therefore,
dx=7")
Example Question #2 : Area
Find the area bounded by the curve 


The curve is in quadrant one over the given interval, which gives us the bounds of integration. Evaluating this definite integral yields the area we are after.
In order to performe the antiderivative, let 

dx= \int u du=\frac{1}{2}u^2 + C = \frac{1}{2} \sin^2 x + C")
so
dx= \left[ \frac {1}{2}\sin^2 x \right] ^\frac{\pi}{2}_0= \left( \frac{1}{2}\sin^2\frac{\pi}{2} \right) - \left( \frac{1}{2}\sin^2 0 \right)=\frac{1}{2}")
Example Question #1 : Area
Find the area bounded by the curve 


")


The curve is positive over the given interval, so the endpoints of the interval will mark the bounds of integration. This function is very easy to integrate because the derivative of 

Example Question #4 : Area
Find the area bounded by the curve 


This function is positve over the given interval, so the endpoints of the interval mark the bounds of integration. It is a straightforward integration that is solvable with u-substitution. Let 


so
-(-e^0)=-\frac{1}{e}+1=\frac{e-1}{e}")

Certified Tutor


All Calculus 1 Resources

