ACT Science : How to find synthesis of data in earth and space sciences
Study concepts, example questions & explanations for ACT Science


All ACT Science Resources
Example Questions
Example Question #1 : How To Find Synthesis Of Data In Earth And Space Sciences
Since the early 1900s, there has been a steady increase in the earth’s atmospheric temperature, resulting in a phenomenon called “Global Warming.” While the steady temperature change has been well documented, the cause of global warming remains controversial.
Scientist 1
Scientist 1 believes that “external forcings” are the cause of increased temperature over the past century. “External forcings” can direct the change in temperature over thousands of years. One example of an external force is variation in the earth’s orbit around the sun. The earth orbital cycle lasts 26,000 years and causes general trends in warming and cooling.
Scientist 2
Scientist 2 believes that global warming is a man-made phenomenon due to an increase in greenhouse gases such as carbon dioxide or methane. Greenhouse gases have a natural warming effect, however, an increase in the amount of atmospheric greenhouse gases many enhance that effect. Since 1750, the concentration of carbon dioxide has increased 36 percent while the amount of atmospheric methane has increased 148 percent.
What data supports Scientist 2's theory?
A graph depicting a negative correlation between the concentration of greenhouse gases and average atmospheric temperature
A graph depicting a postive correlation between the number of humans on earth and the average atmospheric temperature
A graph depicting a positive correlation between the concentration of greenhouse gases and average atmospheric temperature
A graph depicting a negative correlation between the number of humans on earth and the average atmospheric temperature
A graph depicting a positive correlation between the concentration of greenhouse gases and average atmospheric temperature
Because increased temperature is attributed to an increase in greenhouse gases, a graph depicting a postive correlation between the two is suggestive of a relationship between increased production of greenhouse gases and global warming.
Example Question #2 : How To Find Synthesis Of Data In Earth And Space Sciences
Since the early 1900s, there has been a steady increase in the earth’s atmospheric temperature, resulting in a phenomenon called “Global Warming.” While the steady temperature change has been well documented, the cause of global warming remains controversial.
Scientist 1
Scientist 1 believes that “external forcings” are the cause of increased temperature over the past century. “External forcings” can direct the change in temperature over thousands of years. One example of an external force is variation in the earth’s orbit around the sun. The earth orbital cycle lasts 26,000 years and causes general trends in warming and cooling.
Scientist 2
Scientist 2 believes that global warming is a man-made phenomenon due to an increase in greenhouse gases such as carbon dioxide or methane. Greenhouse gases have a natural warming effect, however, an increase in the amount of atmospheric greenhouse gases many enhance that effect. Since 1750, the concentration of carbon dioxide has increased 36 percent while the amount of atmospheric methane has increased 148 percent.
What is a potential cause for an increase in greenhouse gases since 1750?
Production of greenhouse gases during the industrial revolution and population growth
An increase in the number of plants producing carbon dioxide
An increase in gas released from melting ice caps
An increase in clorofluorocarbons resulting in depletion of the ozone layer
Production of greenhouse gases during the industrial revolution and population growth
During the early 1900s, the Industrial Revolution resulted in burning coal for energy, which caused an increase in production of greenhouse gases. Additionally, the increase in population has caused rapid deforestation, reducing the number of plants and trees that consume carbon dioxide. To date, there is no strong link between depletion of the ozone layer and climate change.
Example Question #2 : How To Find Synthesis Of Data In Earth And Space Sciences
Since the early 1900s, there has been a steady increase in the earth’s atmospheric temperature, resulting in a phenomenon called “Global Warming.” While the steady temperature change has been well documented, the cause of global warming remains controversial.
Scientist 1
Scientist 1 believes that “external forcings” are the cause of increased temperature over the past century. “External forcings” can direct the change in temperature over thousands of years. One example of an external force is variation in the earth’s orbit around the sun. The earth orbital cycle lasts 26,000 years and causes general trends in warming and cooling.
Scientist 2
Scientist 2 believes that global warming is a man-made phenomenon due to an increase in greenhouse gases such as carbon dioxide or methane. Greenhouse gases have a natural warming effect, however, an increase in the amount of atmospheric greenhouse gases many enhance that effect. Since 1750, the concentration of carbon dioxide has increased 36 percent while the amount of atmospheric methane has increased 148 percent.
In the year 2438 another ice age occurs, supporting which scientists' theory?
Both Scientists
Scientist 2
Scientist 1
Neither Scientist
Scientist 1
Scientist 1 believes that global warming is a result of cyclical changes in the earth's orbit; therefore, periods of global warming should be followed by periods of global cooling, which can result in another ice age. On the other hand, Scientist 2 believes that as the world's population continues to grow, global warming will also continue. Because there was no data presented to suggest an abrupt change in population growth, scientist 2's theory is incorrect.
Example Question #3 : How To Find Synthesis Of Data In Earth And Space Sciences
Since the early 1900s, there has been a steady increase in the earth’s atmospheric temperature, resulting in a phenomenon called “Global Warming.” While the steady temperature change has been well documented, the cause of global warming remains controversial.
Scientist 1
Scientist 1 believes that “external forcings” are the cause of increased temperature over the past century. “External forcings” can direct the change in temperature over thousands of years. One example of an external force is variation in the earth’s orbit around the sun. The earth orbital cycle lasts 26,000 years and causes general trends in warming and cooling.
Scientist 2
Scientist 2 believes that global warming is a man-made phenomenon due to an increase in greenhouse gases such as carbon dioxide or methane. Greenhouse gases have a natural warming effect, however, an increase in the amount of atmospheric greenhouse gases many enhance that effect. Since 1750, the concentration of carbon dioxide has increased 36 percent while the amount of atmospheric methane has increased 148 percent.
In the year 2150, the United Nations institutes a global limit on the production of greenhouse gases. The average atmospheric temperature continues to increase, although the rate of increase is less than it was before 2150. Does this invalidate the theory proposed by Scientist 2? Why or why not?
No; Increased population may have indirect effects on the concentration of greenhouse gases that can not be regulated.
Yes; Limiting greenhouse gas production does not solve the issue of global warming.
No; A limitation on the production of greenhouses gases will not have an effect on global warming.
Yes; If Scientist 2's theory was correct, the atmospheric temperature would not continue to rise.
No; Increased population may have indirect effects on the concentration of greenhouse gases that can not be regulated.
Because there is a modest change in temperature and increased greenhouse gas concentrations can not be ruled out (through mechanisms such as deforestation), we can not conclude that Scientist 2's theory was correct.
Example Question #4 : How To Find Synthesis Of Data In Earth And Space Sciences
The significant increase in atmospheric carbon dioxide since pre-industrial levels can be seen in the world’s oceans which absorb the CO2 and in turn undergo changes in chemistry. The consequences of increased CO2 include acidification of seawater and a decrease in carbonate ion (CO32-) concentration.
Changes in seawater chemistry affect marine organisms. The early life stages of invertebrates, such as squid, may be particularly vulnerable to changes in carbon dioxide levels. Acting as both predator and prey, squid are a significant component of marine ecosystems. For example, fish and sea birds, such as tuna and albatross, are dependent on squid as a source of prey. Furthermore, the fishing industry is impacted by the health of squid populations. California fisheries produce the majority of market squid.
In order to determine how increased levels of carbon dioxide affect the development of squid, eggs were hatched in two different conditions: normal (380 µatm) and elevated (2100 µatm) levels of CO2. The time to hatch and the size of the larval mantle (the anatomical feature that includes the body wall and fins) were measured and recorded. Two trials were conducted for each carbon dioxide concentration.
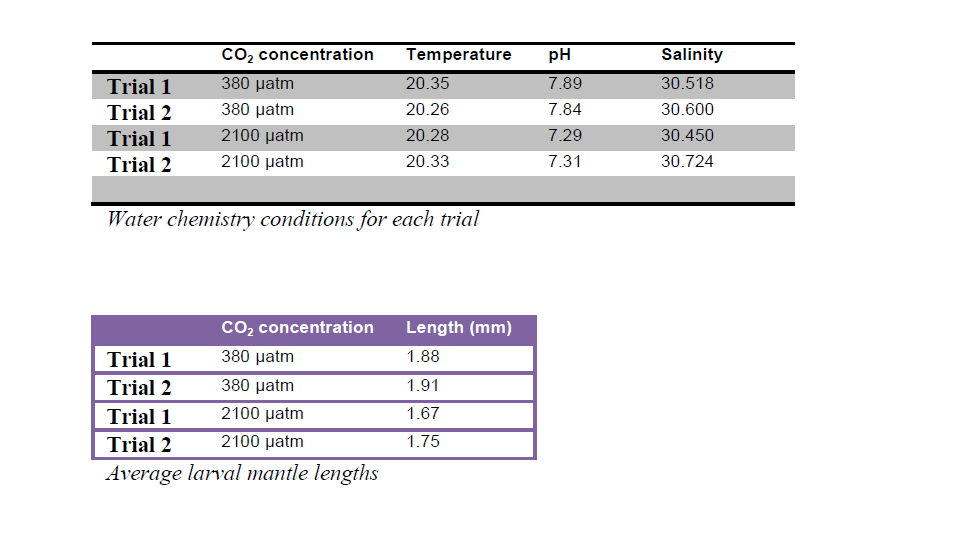
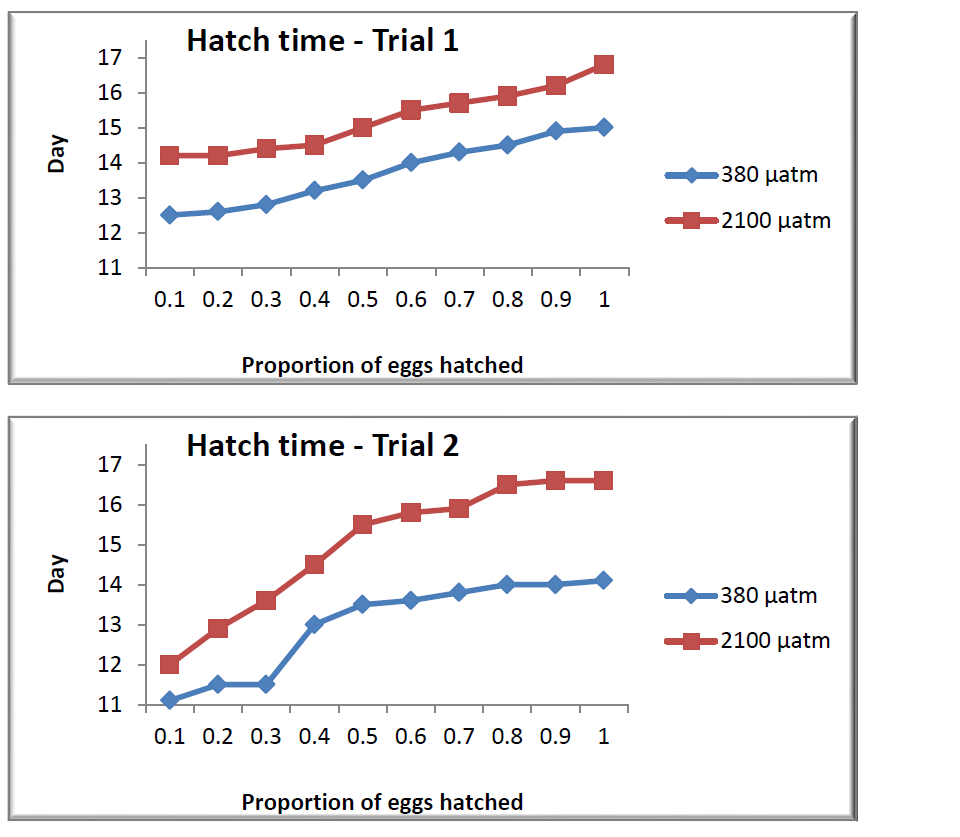
The results of this experiment show that ________.
Lower marine pH levels reduce the hatching time of squid
Lower marine pH levels increase the size of squid
Higher levels of marine carbon dioxide reduce the size of tuna
Higher levels of atmospheric carbon dioxide reduce the size of squid
Higher levels of atmospheric carbon dioxide reduce the size of squid
The only correct correlation given is that increased carbon dioxide levels reduce the size of the squid. Data for tuna size is not given. As for correlation with pH, lower pH levels correspond to increased hatching time of squid and a decrease in the size of squid.
Example Question #5 : How To Find Synthesis Of Data In Earth And Space Sciences
Global warming is defined as the slow increase in the temperature of the earth’s atmosphere and is caused by pollutants and carbon dioxide (CO2). While the gradual increase in temperature cannot be refuted, scientists argue over the cause.
Scientist 1:
Global warming is caused by increases in atmospheric CO2, which is directly created by humans and their consumption of fossil fuels. The natural CO2 released from carbon sinks has a different isotopic ratio from the CO2 released from fossil fuels. Current measurements of the radioactive isotopes of CO2 show that it is from human activity, not from nature. The Earth’s carbon sinks cannot absorb these large amounts of unnatural CO2 emissions. About fifty percent of the CO2 produced by mankind remains in the atmosphere, unable to be absorbed.
Scientist 2:
The rise in atmospheric CO2 levels are a result of global warming, not the cause of it. When the temperature increases, the CO2 in carbon sinks is released. While humans do cause release of CO2, the carbon sinks absorb it. The activity of the carbon sinks increases to allow for higher levels of CO2 absorption. Proponents for human causation of global warming point to the warming and cooling of the stratosphere, however, these temperature fluctuations are caused by changes in the sun’s heat. These proponents also look at the acidity of the ocean as evidence of human causation, however, the rise in ocean acidity is within the normal range of fluctuations over the past ten thousand years.
Which of the following best outlines the evidence provided by Scientist 2 to make his argument?
Human causation, isotopic ratios, ocean acidity
Atmospheric CO2 levels, isotopic ratios, ocean acidity
Carbon sink activity, ocean acidity, and temperature changes
Isotopic ratios, carbon sink activity, ocean acidity
Carbon sink activity, ocean acidity, and isotopic ratios
Carbon sink activity, ocean acidity, and temperature changes
The only answer choice containing three topics that Scientist 2 specifically discusses is "carbon sink activity, ocean acidity, and temperature changes." Scientist 2 does not directly discuss isotope ratios, so any answer containing this option is incorrect.
Example Question #1011 : Act Science
A scientist observes the motion of stars, planets, and other objects in deep space through a high-powered telescope. She observes that these objects all appear to be moving away from the Earth and graphs her results comparing their velocities, in kilometers per second, and their proper distance, in megaparsecs.

A new planet is discovered 11 megaparsecs (MPSC) away from the Earth. Which of the following is its likely velocity?


Based upon the graph, an object at 11 megaparsecs should have a speed of

Example Question #1017 : Act Science
A scientist observes the motion of stars, planets, and other objects in deep space through a high-powered telescope. She observes that these objects all appear to be moving away from the Earth and graphs her results comparing their velocities, in kilometers per second, and their proper distance, in megaparsecs.
Two planets, one with mass 


They will have the same velocity away.
The planet with mass 
The planet with mass 
They will have different velocities, but there is insufficient data to be able to tell which will have the higher velocity.
They will have the same velocity away.
The graph gives absolutely no mention of mass. Because of that, the mass is irrelevant. The only things that the graph charts are distance away from Earth and velocity away from Earth. If they have the same distance, they will have the same velocity.
Example Question #8 : How To Find Synthesis Of Data In Earth And Space Sciences
A scientist observes the motion of stars, planets, and other objects in deep space through a high-powered telescope. She observes that these objects all appear to be moving away from the Earth and graphs her results comparing their velocities, in kilometers per second, and their proper distance, in megaparsecs.
What is the acceleration on these bodies?
Decreasing. While the objects are still moving away, the farther they get the less velocity they have.
Increasing. As they move farther away, their velocities increase.
We need to know the time in order to be able to to tell.
We need to convert kilometers to megaparsecs in order to be able to tell.
Increasing. As they move farther away, their velocities increase.
Based upon the graph, the velocity increases the farther away an objects gets.
Imagine a car that drives down a highway. It starts at 10 mph, then after a mile, it increases to 20mph, then after a mile it increases to 40mph. Even though we don't know the time interval, we can assume that the vehicle is accelerating as it is moving in a roughly linear fashion.
Example Question #5 : How To Find Synthesis Of Data In Earth And Space Sciences
A scientist observes the motion of stars, planets, and other objects in deep space through a high-powered telescope. She observes that these objects all appear to be moving away from the Earth and graphs her results comparing their velocities, in kilometers per second, and their proper distance, in megaparsecs.
Which of the following, if true, would contradict the findings of this experiment?
The Earth does not appear to be moving.
An incredibly hot star seems to be rotating faster than a cold star.
Stars, the same distance away, are moving away at the same speed.
A star is observed moving towards the center of the universe.
A star is observed moving towards the center of the universe.
While the Earth may not "appear" to move, that's due to our relative location to it. This is much like how if you're sitting in a car driving at 60 mph, you feel like you're not moving even though your car (and you inside it) are travelling at 60 mph if observed by anyone outside of the car.
The only one of these that would directly contradict the findings would be for something to be moving towards the center of the universe as the findings point towards everything moving away.

Certified Tutor

Certified Tutor

All ACT Science Resources

