ACT Science : How to find research summary in chemistry
Study concepts, example questions & explanations for ACT Science


All ACT Science Resources
Example Questions
Example Question #41 : How To Find Research Summary In Chemistry
The Environmental Protection Agency compiled the following information about heavy metals in drinking water. Heavy metals are toxic, and thus must be monitored very closely. All amounts are given in parts per billion (ppb), a common measurement of concentration for trace contaminants. Figure 1 shows total heavy metal contamination in each city as a makeup of various percentages of specific contaminants. Figure 2 shows specific amounts of contaminants (with the same color coding) in ppb as well as total contamination level in ppb.

Figure 1

Figure 2
Which city has the most total heavy metal contaminants?
Seattle
Fargo
Chicago
Boston
Boston
Figure 2 shows total heavy metal contaminants in ppb and indicates the makeup of this total. However, this question asks solely for the total amount of contamination. We can see that the bar representing heavy metal contamination in Boston is the highest, and thus is the correct answer to this question.
Example Question #42 : How To Find Research Summary In Chemistry
A scientist decided to use high-tech equipment to measure the electronegativity, an atom's attraction to electrons, of the second period on the periodic table. The results of her measurements are in the chart below. Z is equal to the atomic number of the specified atom and the number of protons in that atom.

Metals are elements that typically have electronegativities of less than 2.0 Debyes. Which of the following sets of atoms do not contain a metal?
Lithium, Beryllium, and Boron
Carbon, Fluorine, Nitrogen
Lithium and Beryllium
Beryllium, Boron, and Carbon
Nitrogen, Oxygen, Lithium
Carbon, Fluorine, Nitrogen
The correct answer is the one that does not include neither lithium nor beryllium. Based on the information provided, we can infer that lithium and beryllium are the only elements listed that are metals due to their low electronegativities.
Example Question #43 : How To Find Research Summary In Chemistry
A scientist decided to use high-tech equipment to measure the electronegativity, an atom's attraction to electrons, of the second period on the periodic table. The results of her measurements are in the chart below. Z is equal to the atomic number of the specified atom and the number of protons in that atom.
An atom's atomic radius tends to follow an opposite trend than electronegativity with regards to an atom's atomic number. Which of the following pairs of atoms does not involve an atom with a larger radius followed by an atom with a smaller radius?
Boron, nitrogen
Oxygen, carbon
Lithium, fluorine
Oxygen, fluorine
Lithium, beryllium
Oxygen, carbon
If atomic radius follows an opposite trend than that of electronegativity with regards to atomic number, then we know that the lower electronegativity of an atom, the greater its atomic radius. Therefore, the correct answer must be an element with a higher atomic number or electronegativity followed by one with a lower atomic number or electronegativity.
Example Question #44 : How To Find Research Summary In Chemistry
Solutions are made by dissolving a solute into a solvent. Different types of solvents have varying levels of solubility, or ability to dissolve certain substances.
A student decided to conduct an experiment to compare the solubilities of different solvents at different temperatures using table salt (sodium chloride) as a solute. The student would keep an amount of solvent at the specified temperature and add solute until no more solute would dissolve. This is amount or solute is called the point of saturation. The amount added to each solvent at saturation was recorded. The results of the experiment are shown in the tables:
Table 1:

Table 2:

Based on the trends shown in the data, what can we predict would happen if we were to increase the temperature of the ethanol solution from 35 degrees Celsius to 45 degrees Celsius?
The solubility would decrease and some salt would precipitate out of the solution
Nothing would happen
The solubility would increase but no visible change would be observed.
The solubility would decrease but no visible change would be observed
The solubility would increase and any undissolved solute at the bottom of the solution would dissolve
The solubility would increase and any undissolved solute at the bottom of the solution would dissolve
The correct answer is that the solubility would increase as we saw in the difference in the data from 20 degrees Celsius to 35 degrees Celsius. With regards to visible changes, if there were undissolved solute at the bottom of the solution, we can be certain that it would dissolve at the temperature increase since the solubility would increase and the solution would gain the capacity to dissolve that leftover solute.
Example Question #45 : How To Find Research Summary In Chemistry
Solutions are made by dissolving a solute into a solvent. Different types of solvents have varying levels of solubility, or ability to dissolve certain substances.
A student decided to conduct an experiment to compare the solubilities of different solvents at different temperatures using table salt (sodium chloride) as a solute. The student would keep an amount of solvent at the specified temperature and add solute until no more solute would dissolve. This is amount or solute is called the point of saturation. The amount added to each solvent at saturation was recorded. The results of the experiment are shown in the tables:
Table 1:
Table 2:
Boiling point elevation is a phenomenon that happens when a solution is made. When a solute is added to a solvent, that solvent's boiling point is increased. The amount that the boiling point is increased depends on how much solute was successfully dissolved in the solvent. Which of the substances used in the student's experiment would most likely experience the least boiling point elevation when working with table salt as a solute?
Water
Dichloromethane
More information is needed
Ethanol
Hexane
Hexane
According to the information provided, the effect of boiling point elevation is determined by the amount of solute dissolved in a solvent. Therefore, it is reasonable to conclude that higher solubility would mean a greater effect of boiling point elevation because it would allow for the dissolution of more solvent. Therefore, water, the substance with the highest solubility in the experiment and hexane is the solvent with the lowest solubility and is thus is the correct choice.
Example Question #46 : How To Find Research Summary In Chemistry
Solutions are made by dissolving a solute into a solvent. Different types of solvents have varying levels of solubility, or ability to dissolve certain substances.
A student decided to conduct an experiment to compare the solubilities of different solvents at different temperatures using table salt (sodium chloride) as a solute. The student would keep an amount of solvent at the specified temperature and add solute until no more solute would dissolve. This is amount or solute is called the point of saturation. The amount added to each solvent at saturation was recorded. The results of the experiment are shown in the tables:
Table 1:
Table 2:
Boiling point elevation is a phenomenon that happens when a solution is made. When a solute is added to a solvent, that solvent's boiling point is increased. The amount that the boiling point is increased depends on how much solute was successfully dissolved in the solvent.
Supersaturation is a state of a solution when there is more solute in the solvent than theoretically possible. A supersaturated solution is created by decreasing the solubility of a solution past the amount of solute already dissolved in the solvent. Based on these two concepts, what conclusion could we draw about the boiling points of supersaturated solutions?
Supersaturated solutions are likely to have only very slightly elevated boiling points
Supersaturated solutions are likely to have highly elevated boiling points
More information is needed to draw a conclusion about the relationship between supersaturation and boiling point elevation
Supersaturated solutions are likely to have similar boiling points as pure solvents
Supersaturated solutions are likely to have lower boiling points than pure solvents
Supersaturated solutions are likely to have highly elevated boiling points
The correct answer is that boiling point elevation would be significant for a supersaturated solution. By definition, a supersaturated solution is one with more solvent dissolved than theoretically possible at that temperature. Therefore, we would expect a very high concentration of solute and therefore a significantly elevated boiling point.
Example Question #47 : How To Find Research Summary In Chemistry
A free energy reaction diagram shows the energy of a chemical reaction as it progresses from start to finish. In Example 1 below, the reactants (at point A) start with a certain energy. Energy is then applied to initiate the reaction (this is called activation energy) and the reaction progresses to point B. Lastly, energy is released in the reaction leading to point C. If the net change in free energy of a reaction is positive, the reaction is called a nonspontaneous reaction, meaning that it takes more energy to initiate it than the energy released. If the net change in free energy of a reaction is negative, it is called spontaneous, meaning that the energy released is more than the energy needed to initiate the reaction.
Example 1:
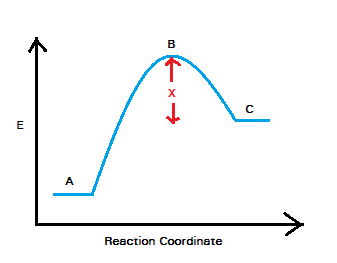
A catalyst is a substance that, when added to a reaction mixture, lowers the "peak" of a free energy reaction diagram. The original energy of the reactants remains the same as well as the final energy of the products. Based on this information, what can we say about catalysts?
Catalysts make reactions spontaneous
Catalysts lower the activation energy
Catalysts make reactions nonspontaneous
Catalysts increase the activation energy
Catalysts decrease the rate of reaction
Catalysts lower the activation energy
The correct answer is that catalysts lower activation energy. If we lower point B on the diagram shown in Example 1, we see that the net change in energy is not affected by a catalyst. Therefore, the reaction's spontaneity or nonspontaneity is irrelevant. The passage also did not say anything about reaction rates and therefore we cannot draw a conclusion (although, for the record, catalysts increase reaction rates).
Example Question #241 : Chemistry
If a drug is taken orally, then the concentration of that drug in the blood will rise to a peak concentration. Immediately afterwards, the elimination phase begins and the concentration of the drug in the body will fall exponentially. Each drug has a half-life (i.e. the time required for the drug's concentration in the blood to fall to half of its original value). Once the elimination phase has initiated, it typically takes four half-lives until the drug has been entirely eliminated from the body.
If an individual is given multiple doses of a drug over time, then the blood concentration of the drug will rise and fall periodically. This creates a graph of drug’s concentration versus time that will resemble a wave. The rising peaks of the graph occur immediately after administration of a dose, whereas the falling valleys occur as the drug is being eliminated. The inter-dose interval, represented by the letter 
Experiment 1
A 125-milligram oral dose of a drug known as Cyclosporin A (CsA) was administered to an individual. The CsA blood concentration for this individual was then measured at various times over the next 24 hours. A graph of CsA concentration versus time was obtained.

Experiment 2
An individual was given multiple doses of CsA over a 60-hour period. The CsA blood concentration was monitored continuously. A graph of CsA concentration versus time was obtained.

Suppose a particular drug has a half life of four hours. The drug is administered and reaches a peak concentration. The elimination phase then begins at zero hours:

At which point will the drug no longer be detectable in the bloodstream?
Four hours after the beginning of the elimination phase:

Sixteen hours after the beginning of the elimination phase:

Nine hours after the beginning of the elimination phase:

Fourteen hours after the beginning of the elimination phase:

Sixteen hours after the beginning of the elimination phase:
The passage states that it takes four half-lives for a drug to be completely eliminated from the body. At this point, it cannot be detected in the bloodstream.


Example Question #49 : How To Find Research Summary In Chemistry
If a drug is taken orally, then the concentration of that drug in the blood will rise to a peak concentration. Immediately afterwards, the elimination phase begins and the concentration of the drug in the body will fall exponentially. Each drug has a half-life (i.e. the time required for the drug's concentration in the blood to fall to half of its original value). Once the elimination phase has initiated, it typically takes four half-lives until the drug has been entirely eliminated from the body.
If an individual is given multiple doses of a drug over time, then the blood concentration of the drug will rise and fall periodically. This creates a graph of drug’s concentration versus time that will resemble a wave. The rising peaks of the graph occur immediately after administration of a dose, whereas the falling valleys occur as the drug is being eliminated. The inter-dose interval, represented by the letter
Experiment 1
A 125-milligram oral dose of a drug known as Cyclosporin A (CsA) was administered to an individual. The CsA blood concentration for this individual was then measured at various times over the next 24 hours. A graph of CsA concentration versus time was obtained.
Experiment 2
An individual was given multiple doses of CsA over a 60-hour period. The CsA blood concentration was monitored continuously. A graph of CsA concentration versus time was obtained.
Based on the results of Experiment 1 and the information in the passage, how does drug concentration change during the elimination phase?
Drug concentration increases then decreases.
Drug concentration decreases linearly.
Drug concentration decreases exponentially.
Drug concentration decreases then increases.
Drug concentration decreases exponentially.
The passage states that drug concentration falls exponentially during the elimination phase. This exponential decay can be seen in the results of Experiment 1 starting at three hours (the beginning of the elimination phase).
Example Question #50 : How To Find Research Summary In Chemistry
Clock reactions are chemical interactions that exhibit a physical change periodically over a given time interval. Many of these reactions involve iodine, the most famous being the Chlorine Dioxide-Iodine-Malonic Acid reaction. These reactions can be quite startling as flasks of colorless liquid periodically turn dark blue and then resolve back to their original colorless state. Even more striking, they seem to alternate between being colorless and blue several times. The term "clock reaction" is derived from the fact that the time at which these sudden changes occur can be predicted.
Beyond performing these reactions in a well stirred beaker, there are two other notable ways to conduct experiments with clock reactions that demonstrate interesting properties of these reactions. The first is in a continuous flow stirred tank reactor (CSTR). In a CSTR, the reactants are introduced at a continuous rate while the volume of liquid in the reactor is kept constant by siphoning off excess fluid. The result of this process is that one can maintain the ideal conditions in which the reaction may occur over time and restricts the buildup of excess product or reactant that would otherwise make the oscillations of the reactions decay. In a CSTR, clock reactions can be maintained switching predictably from colorless to blue, for example, for far longer than in a simple beaker.
The second way to conduct a clock reaction experiment is in a tank with no stirring at all. This allows the reactants to interact heterogeneously, or without being thoroughly mixed. When this occurs, we can get some parts of the tank that are one color and other parts that are another color. This means that we can observe two different stages of the reaction in one vessel. The patterns that this makes are called Turing patterns, named by the great computer scientist Alan Turing. Turing predicted that the heterogeneous mixing of chemicals called morphogens in complex organisms were responsible for biological pattern formation like spots on a leopard, stripes on a zebra, or patterns on a tropical fish. The existence of such patterns and chemicals has since been confirmed and clock reactions are often used to study these types of Turing patterns.
According to the passage, what characteristic of clock reactions sets them apart from other types of reactions?
The reaction always happens at a certain time of day.
The time of the repeated physical changes can be predicted.
The time it takes for the reaction to occur completely is known.
The reaction is sudden and unpredictable.
The reaction undergoes a significant physical change.
The time of the repeated physical changes can be predicted.
The passage explains that the reactions happen "several times" and are "predictable." This only leaves us with one correct answer choice. Many reactions have sudden physical changes associated with them, but clock reactions have oscillatory behavior.

Certified Tutor


All ACT Science Resources

