ACT Science : How to find research summary in chemistry
Study concepts, example questions & explanations for ACT Science


All ACT Science Resources
Example Questions
Example Question #11 : How To Find Research Summary In Chemistry
A student wants to perform an experiment which tests the relationship between the pressure of a gas and the volume it occupies. To perform this experiment, the student places a specific type of gas in a sealed chamber that can change pressure and which can adapt its volume to the gas within it. The chamber also adjusts to the changing pressure such that the temperature (which also has an effect on gas volume) does not change. The following data was obtained:
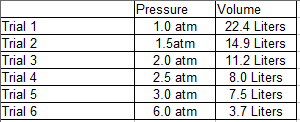
In a second experiment, the student tries the same experiment described in the pre-question text and uses a different gas for each trial. If the readings for volume yielded the same results, what could be said about the relationship between type of gas and volume?
This second experiment would provide the information necessary to discern such a relationship, but to reach a conclusion we would need information about which gasses were used.
The variables are not related.
They are directly related.
They are inversely related.
This second experiment does not provide information about this relationship and therefore no conclusion can be reached.
The variables are not related.
The correct answer is that there is no relationship. As type of gas was one of the variables held constant in the first experiment, once the type of gas was no longer held constant, we would expect different results than those that experiment one yielded; however, since the data came out the same, we can safely conclude that there is no observable relationship between type of gas and volume.
Example Question #201 : Chemistry
Two scientists wanted to test the solubility of different substances. Solubility is a measure of how many moles of a given substance (known as the solute) can dissolve in a given volume of another substance (known as the solvent). The solvent can also be thought of as the substance present in greater amount, while the solute can be seen as the substance present in lesser amount. The scientists performed the following experiments to investigate this property.
Experiment 1
The scientists tested the number of moles of several substances that could be completely dissolved in 
Table 1

Experiment 2
In this experiment, the scientists wanted to test the solubility of 
Table 2

Which of the following correctly ranks the solutes from Experiment 1 in decreasing order of solubility in water at 


The introduction explains that solubility is a measure of how many moles of a substance can dissolve in a given volume of another substance. This is a very important clue that tells us we need to focus on the "moles added" column rather than the "grams added" column. We need to rank our substances in decreasing order, so we need start with the one with the highest solubility at 
The number of moles dissolved at 


So the correct order is:

Example Question #202 : Chemistry
Two scientists wanted to test the solubility of different substances. Solubility is a measure of how many moles of a given substance (known as the solute) can dissolve in a given volume of another substance (known as the solvent). The solvent can also be thought of as the substance present in greater amount, while the solute can be seen as the substance present in lesser amount. The scientists performed the following experiments to investigate this property.
Experiment 1
The scientists tested the number of moles of several substances that could be completely dissolved in
Table 1
Experiment 2
In this experiment, the scientists wanted to test the solubility of
Table 2
Which of the following best explains the relationship between temperature and solubility of 
As temperature decreases, solubility of 
As temperature increases, solubility of 
As temperature decreases, solubility of 
There is no clear relationship between temperature and solubility of 
As temperature increases, solubility of 
As temperature decreases, solubility of
This question doesn't tell us where to look, but it tells us we need to be concerned with solubility of 


Example Question #211 : Chemistry
Two scientists wanted to test the solubility of different substances. Solubility is a measure of how many moles of a given substance (known as the solute) can dissolve in a given volume of another substance (known as the solvent). The solvent can also be thought of as the substance present in greater amount, while the solute can be seen as the substance present in lesser amount. The scientists performed the following experiments to investigate this property.
Experiment 1
The scientists tested the number of moles of several substances that could be completely dissolved in
Table 1
Experiment 2
In this experiment, the scientists wanted to test the solubility of
Table 2
In Experiment 2, which of the following combinations of temperature and solvent dissolved the greatest number of moles of 
Methanol at

Water at

Ethanol at


To find the correct answer to this question, we need to look for it in Table 2. We are asked to find the greatest number of moles of 
In this case, the largest number of moles dissolved is 


Example Question #895 : Act Science
An experiment was carried out measuring the boiling point and freezing point of an unknown organic liquid (Sample X) with varying levels of salt dissolved within it. The experiment was conducted in the following manner:
First, the experimenter measured the boiling point and freezing point of Sample X.
Next, a known quantity of salt was dissolved into the sample and then the boiling point and freezing points were measured again.
The results of the experiment are outlined in the table below:

What can we say is the relationship between concentration of salt in Sample X and the boiling point of Sample X?
A positive linear correlation
We cannot conclude that there is any definite relationship.
A negative linear correlation
A positive exponential correlation
A negative exponential correlation
A positive linear correlation
The correct answer is that the boiling point of Sample X is positively and linearly correlated with the concentration of salt dissolved in Sample X. As we can see on the chart provided, every time the experimenter increased the concentration of the salt by 10 mg/L, the boiling point of Sample X increased by 1.4 degrees Celsius. Therefore, we can call this a positive linear correlation.
Example Question #896 : Act Science
An experiment was carried out measuring the boiling point and freezing point of an unknown organic liquid (Sample X) with varying levels of salt dissolved within it. The experiment was conducted in the following manner:
First, the experimenter measured the boiling point and freezing point of Sample X.
Next, a known quantity of salt was dissolved into the sample and then the boiling point and freezing points were measured again.
The results of the experiment are outlined in the table below:
If the variable 


More information is necessary.


Don't be confused by the symbols and equations. At its core, this question is simply asking about the relationship observed for melting point and concentration of salt in Sample X. As we can see on the table, every time the concentration increases by 10 mg/L, the melting point decreases by 3.0 degrees Celsius. This indicates a negative but linear correlation. Therefore, the answer is 


Any answer with the variable 
Example Question #897 : Act Science
An experiment was carried out measuring the boiling point and freezing point of an unknown organic liquid (Sample X) with varying levels of salt dissolved within it. The experiment was conducted in the following manner:
First, the experimenter measured the boiling point and freezing point of Sample X.
Next, a known quantity of salt was dissolved into the sample and then the boiling point and freezing points were measured again.
The results of the experiment are outlined in the table below:
If the variable 


More information is necessary.
At its core, this question is asking about the relationship observed for boiling point and concentration of salt in Sample X. As we can see on the table, every time the concentration increases by 10 mg/L, the boiling point increases by 1.4 degrees Celsius. This indicates a positive and linear correlation. Therefore, the answer is 


Any answer with the variable 
Example Question #898 : Act Science
In studying the effects of adding heat to different substances on each substance's temperature, a researcher conducted the following experiment. The researcher added 1,000 Joules of energy by a controlled heat lamp to four different substances. The temperature change in each substance that was caused by the heat was then measured and recorded. The results of this experiment are shown below.

The researcher is aware of a concept called specific heat and knows that lead has a lower specific heat than wood, which has a lower specific heat than cardboard, which has a lower specific heat than styrofoam. Therefore, the researcher has ordered the objects in the table from lowest specific heat (lead) to highest (styrofoam).
The researcher wants to use the information collected to build a container to store some cell samples that must remain at a low temperature to survive. According tot he data, which substance would be ideal for this container?
Cardboard
Based on the presented data, none of the substances would be notably better than any of the others.
Styrofoam
Wood
Lead
Styrofoam
The correct answer is styrofoam. You might make this prediction from common sense, but we can reach this same conclusion by considering the presented experimental data. The styrofoam's large specific heat causes it to change temperature only slightly when exposed to heat. Therefore, it is ideal for keeping objects cool. This is why styrofoam is often used for disposable coolers and coffee cups.
Example Question #11 : How To Find Research Summary In Chemistry
In studying the effects of adding heat to different substances on each substance's temperature, a researcher conducted the following experiment. The researcher added 1,000 Joules of energy by a controlled heat lamp to four different substances. The temperature change in each substance that was caused by the heat was then measured and recorded. The results of this experiment are shown below.
The researcher is aware of a concept called specific heat and knows that lead has a lower specific heat than wood, which has a lower specific heat than cardboard, which has a lower specific heat than styrofoam. Therefore, the researcher has ordered the objects in the table from lowest specific heat (lead) to highest (styrofoam).
Which of the following equations would most likely allow us to model the temperature change 


The correct answer is 
Example Question #211 : Chemistry
When describing their behavior, gases are typically treated as "ideal gases" in what is known as the ideal gas law. Two science students describe the ideal gas law in their own terms:
Student 1: The ideal gas law is based on the assumptions that a gas consists of a large number of molecules and that gas molecules take up negligible space in a gas due to their minuscule size in comparison to the space between each gas molecule. Also important is the assumption that all of the forces acting on gas molecules are from collisions with other gas molecules or a container and not from anything else. According to the ideal gas law, all gases behave the same so long as those assumptions hold true. Therefore, if you measure the volume of helium gas at a certain temperature and pressure, an equivalent amount of radon gas (a much heavier gas) at the same conditions will have the same volume.
Student 2: The ideal gas law's primary assumption is that a gas consists of a very large number of particles. For example, even within a single bacteria there can be billions of gas molecules despite the bacteria's very small size. Therefore, in a room full of gas, there are so many particles that their random behavior is, on average, uniform. There are exceptions to the ideal gas law and those are gases with very high inter-molecular forces of attraction (IMFAs). A gas with high IMFA will behave very differently than a gas with a low IMFA. As one could imagine, because a gas with a high IMFA will have molecules that tend to attract each other, that gas will display a lower volume than that which would be predicted by the ideal gas law.
"Dipole moment" is a measure of IMFAs. A higher dipole moment corresponds with greater IMFAs. Water has a high dipole moment (1.85 debyes) but is a relatively small molecule (molecular weight = 18 amu).
A gas (Compound X) is found to have a dipole moment of about 1.84 debyes and is much larger than water, weighing approximately 190 amu. Assuming Student 1's statements are correct, how would the volume of a quantity of Compound X gas compare with that of the same quantity of water vapor when we do not assume ideal behavior?
The volume of water vapor would be slightly greater than that of Compound X.
The volume of Compound X would be slightly greater than that of the water vapor.
More information is necessary.
Both Compound X and the water vapor would occupy the same exact volume.
The volume of Compound X would be significantly greater than that of the water vapor.
The volume of Compound X would be slightly greater than that of the water vapor.
This question is a bit tricky. The correct answer here is that the volume of Compound X would be slightly greater than that of the water vapor. This is because, as the passage states, molecules are so much smaller than the space between gas molecules, differences in molecule size make negligible differences for volume between two gases. This is what is behind the ideal gas law. However, if, as the question states, we do not assume ideal behavior, we need to consider the volume taken up by the larger Compound X molecules. Therefore we know that Compound X will occupy a larger volume. We also know that this extra volume is something that is typically treated as negligible (as just stated), and therefore the difference is only slight, not significant.


Certified Tutor

All ACT Science Resources

