ACT Science : Biology
Study concepts, example questions & explanations for ACT Science


All ACT Science Resources
Example Questions
Example Question #81 : Act Science
In contrast to prokaryotes, eukaryotes have membrane-bound organelles that allow their cell(s) to compartmentalize different cellular functions. These different functions, which occur only within membrane-bound organelles, include the synthesis and breakdown of different macronutrients fatty acids and proteins. Other processes like glycolysis (the breakdown of carbohydrates) and nucleic acid breakdown can occur outside membrane-bound organelles. Synthesizing different macronutrients is known as anabolism, while breaking down these same nutrients into Adenosine Tri-Phosphate (ATP) is called catabolism.
Macronutrient anabolism and catabolism are balanced by the supply of available energy. In the fed state, where a high concentration of sugar is dissolved in your blood stream, the body prefers to use glucose as its energy source through a pathway called glycolysis. When the supply of glucose in the blood runs low, however, the liver is able to synthesize new glucose in a process called gluconeogenesis. In gluconeogenesis, oxaloacetate, the product of another cycle called the Krebs Cycle is used as the starting point to run glycolysis in reverse, making a new glucose molecule. When these precursors needed to initiate gluconeogenesis run low, the body then turns to the catabolism of proteins and free fatty acids.
Proteins, composed of strands of amino acids, are broken down to generate ATP and oxaloacetate. People who have not eaten for an extended period of time experience low muscle mass due to catabolism of skeletal muscle proteins. Only after available protein is broken down does beta oxidation of free fatty acids begin.
Beta oxidation uses free fatty acids floating in the blood to generate the greatest amount of ATP per gram of starting material of any of the macronutrients. Carried out by enzymes called lipases, beta oxidation splits a long fatty acid chain into two carbon units called acetyl-CoA. Per acetyl-CoA that enters the Krebs Cycle, three NADH and one FADH2 are produced that enter the Electron Transport Chain to drive ATP production. 1 NADH molecule can generate 3 ATP, while 1 FADH2 molecule can generate 2 ATP. Lipases continue to cleave acetyl-COA units off the parent lipid chain until it either produces its last acetyl-CoA molecule or ends in a 3 carbon molecule called propyl-CoA. Propyl-CoA can further undergo catabolism to yield one final acetyl-CoA molecule.
A 6-carbon free fatty acid could be expected to produce how many NADH?
13
2
7
9
9
A 6 Carbon unit would be able to give 3 acetyl-CoA according to the last paragraph. Each Acetyl-CoA generates 3 NADH, giving a total of 9 NADH for the 6 Carbon molecule.
Example Question #82 : Act Science
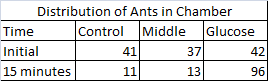
A researcher studies the olfactory (scent-related) senses of the giant forest ant, Camponotus gigas. The researcher places 120 ants in a three-chambered cell. The cell has an end section with a cotton ball soaked in a saline solution and another end with a cotton ball soaked in a glucose solution. The ants are placed in the middle and timed for 15 minutes. Their initial and final positions in the cell are recorded (see Table 1). The researcher's null hypothesis states that the distribution of ants across the three chambers will be equal to one another. In other words, the glucose solution will have no effect and there will be no significant difference in the distribution of the insects.
Table 1
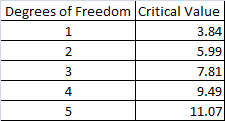
The researcher decides to perform a statistical test known as a Chi-squared test of independence to interpret the experiment's results. The test is performed by calculating a Chi-squared statistic by utilizing observed and expected values for distribution (see Table 2). If the sum of the Chi-squared test statistic is higher than the critical value, then the null hypothesis can be rejected. This indicates that the distribution of insects is not random and the variable in question has a pronounced effect on the subjects. A critical value is calculated by determining the degrees of freedom, which in this experiment is equal to the number of categories in the study minus one, and then locating the proper number on a table (see Table 3). There are three possible categories in this experiment: the glucose end, the control end (with the saline-solution soaked cotton ball), and middle portion of the chamber.
Table 2
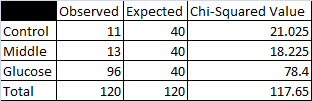
Table 3
If the null hypothesis for this study were supported, what could be said about the ants' distribution?
Most of the ants would be found in the center chamber of the cell.
Most of the ants would be found in the outer ends of the cell chambers.
None of the other choices represent how the ants would distribute themselves if the null hypothesis were supported.
The ants would be equally distributed throughout the cell's chambers.
The ants would be equally distributed throughout the cell's chambers.
The null hypothesis describes what results the experiment will yield if the variable being measured makes no difference to the results. This means that the ants should have no difference in their distribution across the cell if the null hypohtesis is supported, since they will not be attracted to the glucose any more than they would be attracted to any other part of the test chamber. If the null hypothesis is supported for this study, then the ants should be distribute themselves equally throughout the chambers.
Example Question #83 : Act Science
A researcher studies the olfactory (scent-related) senses of the giant forest ant, Camponotus gigas. The researcher places 120 ants in a three-chambered cell. The cell has an end section with a cotton ball soaked in a saline solution and another end with a cotton ball soaked in a glucose solution. The ants are placed in the middle and timed for 15 minutes. Their initial and final positions in the cell are recorded (see Table 1). The researcher's null hypothesis states that the distribution of ants across the three chambers will be equal to one another. In other words, the glucose solution will have no effect and there will be no significant difference in the distribution of the insects.
Table 1
The researcher decides to perform a statistical test known as a Chi-squared test of independence to interpret the experiment's results. The test is performed by calculating a Chi-squared statistic by utilizing observed and expected values for distribution (see Table 2). If the sum of the Chi-squared test statistic is higher than the critical value, then the null hypothesis can be rejected. This indicates that the distribution of insects is not random and the variable in question has a pronounced effect on the subjects. A critical value is calculated by determining the degrees of freedom, which in this experiment is equal to the number of categories in the study minus one, and then locating the proper number on a table (see Table 3). There are three possible categories in this experiment: the glucose end, the control end (with the saline-solution soaked cotton ball), and middle portion of the chamber.
Table 2
Table 3
What should be done with the null hypothesis based on the results of this experiment?
None of the other choices is correct.
The null hypothesis should be supported.
The null hypothesis should be rejected.
The researcher should fail to reject the null hypothesis.
The null hypothesis should be rejected.
The researcher obtained a Chi-squared test statistic of 

Example Question #81 : How To Find Data Representation In Biology
A researcher studies the olfactory (scent-related) senses of the giant forest ant, Camponotus gigas. The researcher places 120 ants in a three-chambered cell. The cell has an end section with a cotton ball soaked in a saline solution and another end with a cotton ball soaked in a glucose solution. The ants are placed in the middle and timed for 15 minutes. Their initial and final positions in the cell are recorded (see Table 1). The researcher's null hypothesis states that the distribution of ants across the three chambers will be equal to one another. In other words, the glucose solution will have no effect and there will be no significant difference in the distribution of the insects.
Table 1
The researcher decides to perform a statistical test known as a Chi-squared test of independence to interpret the experiment's results. The test is performed by calculating a Chi-squared statistic by utilizing observed and expected values for distribution (see Table 2). If the sum of the Chi-squared test statistic is higher than the critical value, then the null hypothesis can be rejected. This indicates that the distribution of insects is not random and the variable in question has a pronounced effect on the subjects. A critical value is calculated by determining the degrees of freedom, which in this experiment is equal to the number of categories in the study minus one, and then locating the proper number on a table (see Table 3). There are three possible categories in this experiment: the glucose end, the control end (with the saline-solution soaked cotton ball), and middle portion of the chamber.
Table 2
Table 3
What is the critical value of this experiment?


None of the choices are correct

Paragraph two states the following: "A critical value is calculated by determining the degrees of freedom, which in this experiment is equal to the number of categories in the study minus one, and then locating the proper number on a table (see Table 3). There are three possible categories in this experiment: the glucose end, the control end (with the saline-solution soaked cotton ball), and middle portion of the chamber."
The degrees of freedom are found by subtracting one from the number of catagories. There are three catagories; therefore, the the degrees of freedom for the statistical test is two.

According to Table 3, 
Example Question #85 : Act Science
Population dynamics can be described as the intricate relationships and mechanics of a given ecological community. Ecology attempts to study the interactions between organisms and between organisms and their environments. Populations of organisms may be impacted by abiotic (nonliving) and biotic (living) factors within their environment. These factors may or may not depend on population densities. Density-independent factors such as weather patterns can affect a population of any size. Conversely, density-dependent factors such as predation have differing effects on populations based on the number of individuals present.
Utilizing this information, consider the following scenario.
An island contains several wolf and moose populations. Ecologists studied these populations through several generations and made observations on each population's size and relative fitness. In the initial years of the investigation, wolf populations declined due to a disease known as canine parvovirus. Due to decreased predatory pressures, the moose population rose to higher numbers than seen in previous years. Several years later, environmental temperatures rose dramatically in the area. Increased environmental temperatures resulted in reduced fitness and health within the island's moose population. Individuals were exposed to rising tick populations that caused blood loss and spread disease. Likewise, increased temperatures induced weight loss in the moose population; moose cannot perspire and must cool themselves by resting in the shade, and this detracts from their ability to forage and gain weight and insulation for the colder winter months. The weakened moose population became susceptible to increased predation by wolves, which resulted in an increase in the wolf population. (See Figures 1, 2, and 3.)

According to Figure 3, what happens to the tick population from the months of January to December?
The population increases in the winter and spring months and decreases dramatically in the summer.
The population increases over time.
The population decreases over time.
The population grows exponentially through the spring and summer and decreases dramatically in the winter.
The population grows exponentially through the spring and summer and decreases dramatically in the winter.
According to Figure 3, the tick population follows the form of an exponential growth curve during the the spring and summer months. During the winter frost, the population is reduced to very low numbers. This information is supported by figures in the passage.
Example Question #86 : Act Science
Population dynamics can be described as the intricate relationships and mechanics of a given ecological community. Ecology attempts to study the interactions between organisms and between organisms and their environments. Populations of organisms may be impacted by abiotic (nonliving) and biotic (living) factors within their environment. These factors may or may not depend on population densities. Density-independent factors such as weather patterns can affect a population of any size. Conversely, density-dependent factors such as predation have differing effects on populations based on the number of individuals present.
Utilizing this information, consider the following scenario.
An island contains several wolf and moose populations. Ecologists studied these populations through several generations and made observations on each population's size and relative fitness. In the initial years of the investigation, wolf populations declined due to a disease known as canine parvovirus. Due to decreased predatory pressures, the moose population rose to higher numbers than seen in previous years. Several years later, environmental temperatures rose dramatically in the area. Increased environmental temperatures resulted in reduced fitness and health within the island's moose population. Individuals were exposed to rising tick populations that caused blood loss and spread disease. Likewise, increased temperatures induced weight loss in the moose population; moose cannot perspire and must cool themselves by resting in the shade, and this detracts from their ability to forage and gain weight and insulation for the colder winter months. The weakened moose population became susceptible to increased predation by wolves, which resulted in an increase in the wolf population. (See Figures 1, 2, and 3.)
According to Figure 2, what happened to the wolf population from the months of January to December?
The population decreased due to the canine parvovirus.
Increased temperatures promoted foraging and reproductive behaviors that boosted the wolf population's numbers.
The population numbers increased due to easier predation of a moose population of reduced fitness.
The population increased due to the canine parvovirus.
The population numbers increased due to easier predation of a moose population of reduced fitness.
The warmer temperatures on the island reduced the moose population's weight and fitness. Their reduced fitness made them easy targets for the wolves that had recently suffered reduced numbers due to the canine parvovirus. The wolf population was then able to grow in numbers due to a lack of disease and the presence of a readily available prey population.
Example Question #87 : Act Science
Population dynamics can be described as the intricate relationships and mechanics of a given ecological community. Ecology attempts to study the interactions between organisms and between organisms and their environments. Populations of organisms may be impacted by abiotic (nonliving) and biotic (living) factors within their environment. These factors may or may not depend on population densities. Density-independent factors such as weather patterns can affect a population of any size. Conversely, density-dependent factors such as predation have differing effects on populations based on the number of individuals present.
Utilizing this information, consider the following scenario.
An island contains several wolf and moose populations. Ecologists studied these populations through several generations and made observations on each population's size and relative fitness. In the initial years of the investigation, wolf populations declined due to a disease known as canine parvovirus. Due to decreased predatory pressures, the moose population rose to higher numbers than seen in previous years. Several years later, environmental temperatures rose dramatically in the area. Increased environmental temperatures resulted in reduced fitness and health within the island's moose population. Individuals were exposed to rising tick populations that caused blood loss and spread disease. Likewise, increased temperatures induced weight loss in the moose population; moose cannot perspire and must cool themselves by resting in the shade, and this detracts from their ability to forage and gain weight and insulation for the colder winter months. The weakened moose population became susceptible to increased predation by wolves, which resulted in an increase in the wolf population. (See Figures 1, 2, and 3.)
According to Figure 1, what happened to the moose population from the months of January to December?
The population increased and then decreased over time.
The population decreased and then increased over time.
The population increased over time.
The population decreased over time.
The population decreased over time.
The population decreased over time. Analysis of the figure reveals that the population number was around 180 individuals in January and was reduced to under 100 individuals in December. This is supported by the Figure 1.
Example Question #88 : Act Science
Background
Plants take in nutrients through extensive root systems, as well as from the air through leaves or needles. Many coniferous evergreens are able to survive for a few weeks after being cut down due to their water-saving needles.
A group of students investigated the properties of several types of coniferous evergreens once they had been extracted from their environments. The students compared the length of time before needles (modified leaves) began to fall from the trees. They placed recently severed, seven-foot trees in spaces with controlled temperature and environmental conditions, and then monitored them closely over several days.
Experiment 1
The students placed representative samples of several varieties of coniferous evergreen in a controlled environment: 20°C, 1 atm, and 35% humidity. They recorded the number of days before needles began to fall for each species.
Results: Experiment 1
|
Species Name |
Days Before Needle Drop |
|
Grand Fir |
28 |
|
Virginia Pine |
29 |
|
Douglas Fir |
35 |
|
Pinyon Pine |
32 |
Experiment 2
The students used the Douglas Fir to conduct a second experiment. They placed new trees in enclosed spaces, varied the temperature and humidity of the trees' environments, and recorded the number of days before needles began to fall.
Results: Experiment 2
|
Temperature |
Humidity |
Days Before Needle Drop |
|
20°C |
55% |
37 |
|
30°C |
55% |
33 |
|
20°C |
45% |
36 |
|
30°C |
45% |
32 |
|
20°C |
65% |
39 |
|
30°C |
65% |
35 |
Based on the results of Method 1, which species of tree is able to conserve the most water after the root system has been severed?
Not enough information
Pinyon Pine
Grand Fir
Douglas Fir
Virginia Pine
Douglas Fir
The background mentions that evergreens are able to survive after being cut due to their water-saving needles. According to the results of Experiment 1, the Douglas Fir lasted the longest before dropping its needles, so it can be inferred that it conserved the most water.
Example Question #89 : Act Science
Background
Plants take in nutrients through extensive root systems, as well as from the air through leaves or needles. Many coniferous evergreens are able to survive for a few weeks after being cut down due to their water-saving needles.
A group of students investigated the properties of several types of coniferous evergreens once they had been extracted from their environments. The students compared the length of time before needles (modified leaves) began to fall from the trees. They placed recently severed, seven-foot trees in spaces with controlled temperature and environmental conditions, and then monitored them closely over several days.
Experiment 1
The students placed representative samples of several varieties of coniferous evergreen in a controlled environment: 20°C, 1 atm, and 35% humidity. They recorded the number of days before needles began to fall for each species.
Results: Experiment 1
|
Species Name |
Days Before Needle Drop |
|
Grand Fir |
28 |
|
Virginia Pine |
29 |
|
Douglas Fir |
35 |
|
Pinyon Pine |
32 |
Experiment 2
The students used the Douglas Fir to conduct a second experiment. They placed new trees in enclosed spaces, varied the temperature and humidity of the trees' environments, and recorded the number of days before needles began to fall.
Results: Experiment 2
|
Temperature |
Humidity |
Days Before Needle Drop |
|
20°C |
55% |
37 |
|
30°C |
55% |
33 |
|
20°C |
45% |
36 |
|
30°C |
45% |
32 |
|
20°C |
65% |
39 |
|
30°C |
65% |
35 |
Based on the results of Method 2, what effect does humidity have on the water retention of Douglas Firs?
Temperature is negatively correlated with water retention because higher temperature corresponds to longer tree life.
Temperature is positively correlated with water retention because higher temperature corresponds to longer tree life.
Humidity is positively correlated with water retention because lower humidity corresponds to longer tree life.
Humidity is positively correlated with water retention because higher humidity corresponds to longer tree life.
Humidity is negatively correlated with water retention because higher humidity corresponds to longer tree life.
Humidity is positively correlated with water retention because higher humidity corresponds to longer tree life.
We know that water retention is positively correlated with days before needle drop, because the background mentions that evergreens can survive without roots due to their water conservation adaptations. Looking at the results of Experiment 2, we can see that when humidity is higher, the trees last longer. At 55% humidity and 20 degrees Celsius, the needles last 37 days, and at 65% humidity and 20 degrees Celsius, the needles last 39. Thus, humidity is positively correlated with water retention and tree life.
Example Question #90 : Act Science
Background
Plants take in nutrients through extensive root systems, as well as from the air through leaves or needles. Many coniferous evergreens are able to survive for a few weeks after being cut down due to their water-saving needles.
A group of students investigated the properties of several types of coniferous evergreens once they had been extracted from their environments. The students compared the length of time before needles (modified leaves) began to fall from the trees. They placed recently severed, seven-foot trees in spaces with controlled temperature and environmental conditions, and then monitored them closely over several days.
Experiment 1
The students placed representative samples of several varieties of coniferous evergreen in a controlled environment: 20°C, 1 atm, and 35% humidity. They recorded the number of days before needles began to fall for each species.
Results: Experiment 1
|
Species Name |
Days Before Needle Drop |
|
Grand Fir |
28 |
|
Virginia Pine |
29 |
|
Douglas Fir |
35 |
|
Pinyon Pine |
32 |
Experiment 2
The students used the Douglas Fir to conduct a second experiment. They placed new trees in enclosed spaces, varied the temperature and humidity of the trees' environments, and recorded the number of days before needles began to fall.
Results: Experiment 2
|
Temperature |
Humidity |
Days Before Needle Drop |
|
20°C |
55% |
37 |
|
30°C |
55% |
33 |
|
20°C |
45% |
36 |
|
30°C |
45% |
32 |
|
20°C |
65% |
39 |
|
30°C |
65% |
35 |
Based on the results of Experiment 2, what value would you expect for the number of days until needle drop at 20°C and 75% humidity?
Approximately 44 days
Approximately 55 days
Approximately 36 days
Approximately 28 days
Approximately 41 days
Approximately 41 days
Based on the results, we know that days until needle drop increases as humidity increases at a constant temperature. At 65% humidity, the needles dropped at 39 days, so we can assume that at 75% humidity, the needles will stay on for slightly longer. The answer “41” is closest to the established pattern.


All ACT Science Resources

